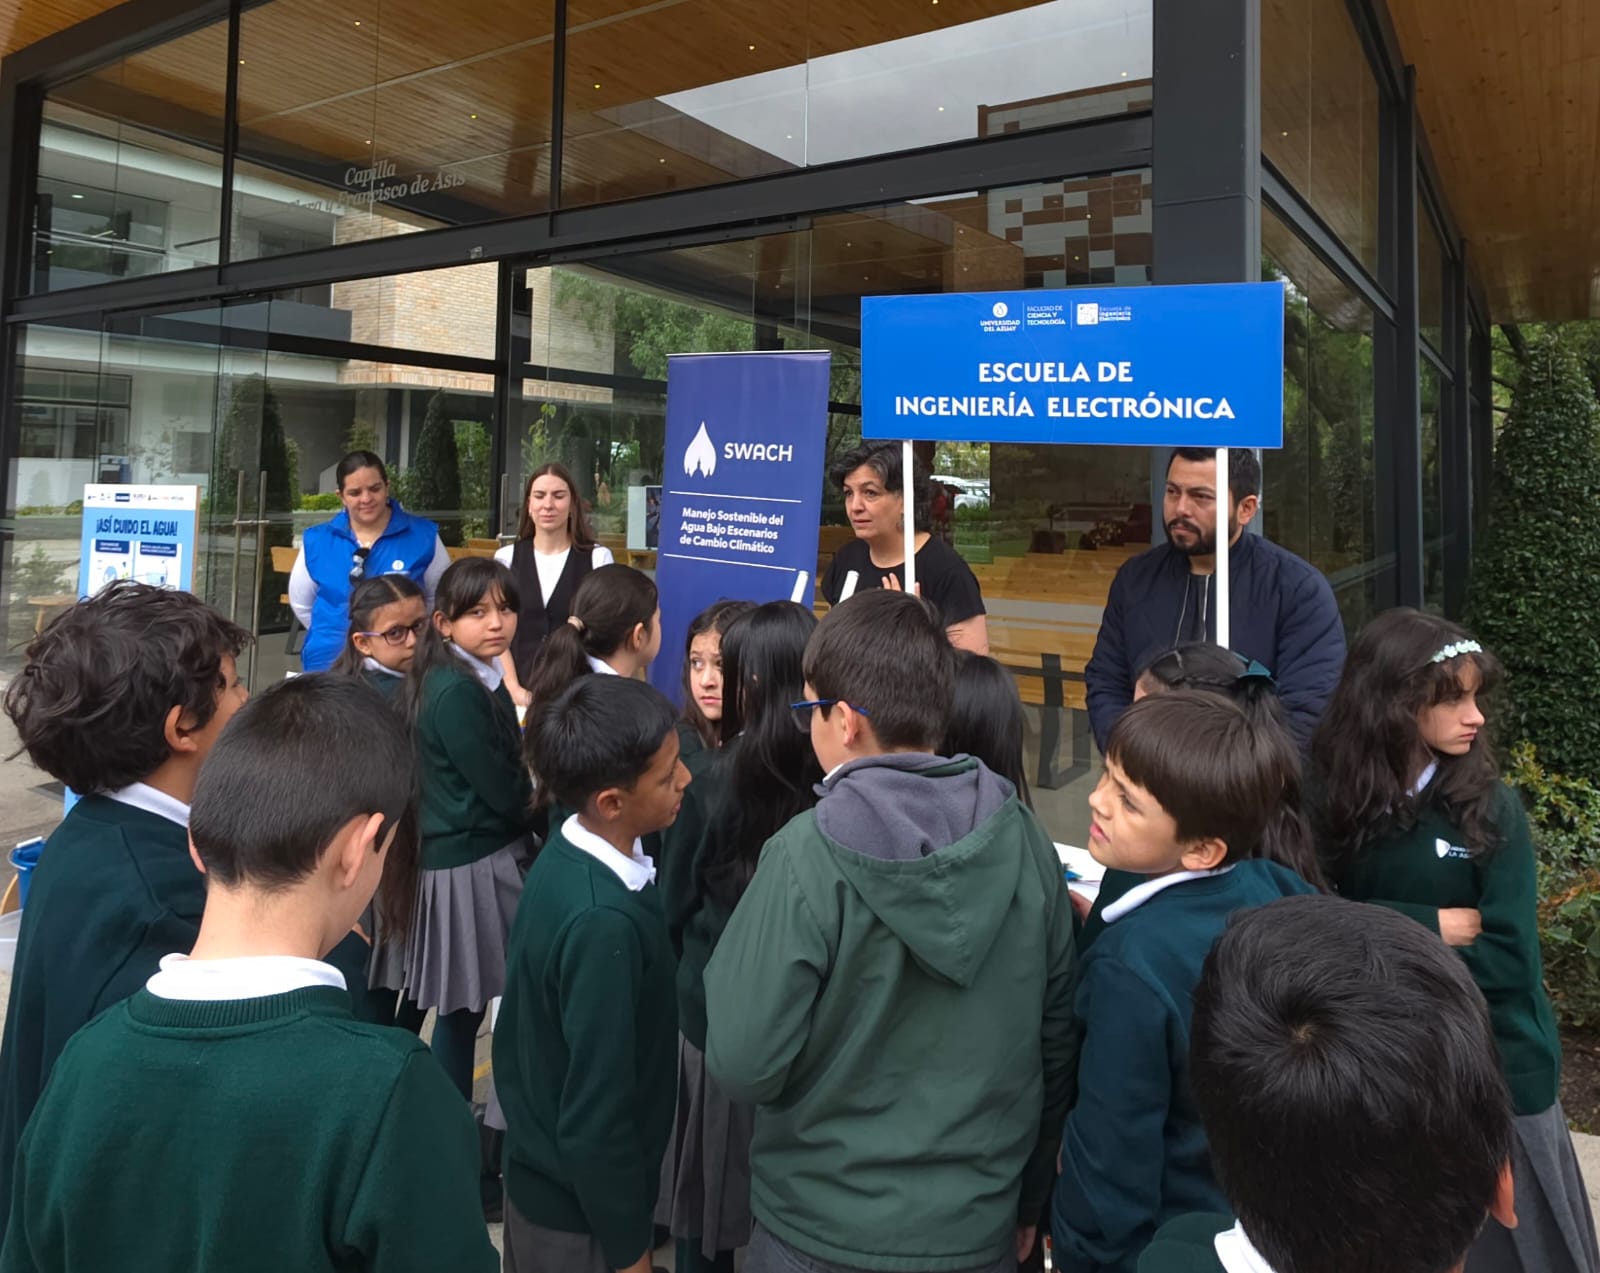
Dentro del proyecto SWACH se realiza un estudio sobre la demanda de agua potable para el consumo residencial en la ciudad de Cuenca. Para ello, se estudian tres barrios piloto, con el objetivo de levantar información sobre los hábitos y percepción de consumo de agua potable en los hogares e identificar con los moradores estrategias para el consumo responsable, que estén dispuestos a aplicarlos.
Para la selección de los barrios se definieron los siguientes criterios:
- Barrio con predominio de uso de suelo residencial y abastecido por ETAPA-EP, del Sistema Tomebamba. (prevalencia de viviendas unifamiliares; bajo uso de actividades comerciales; sin actividades industriales o agrícolas)
- Contar con tejido social (dirigencia, organización) y una delimitación clara del barrio como identidad.
- Características sociodemográficas comunes al interior del barrio y diferenciados entre ellos: tamaño de lotes/densidad poblacional/presencia de beneficiarios de bonos estatales.
- Tener conexión a internet y preferentemente dentro de la zona de influencia de la Universidad del Azuay.
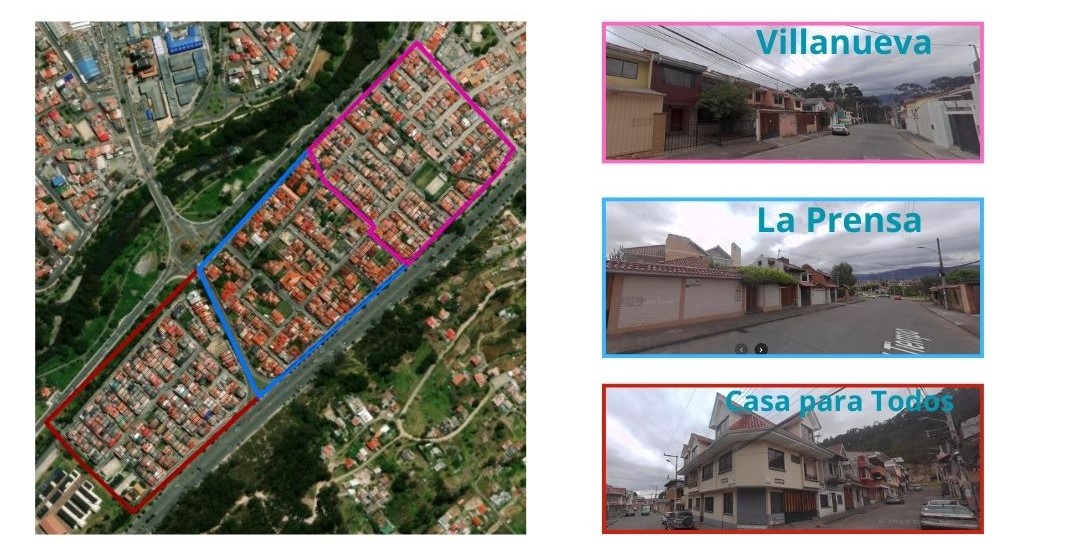
Aplicados los criterios se seleccionó a los Barrios Casa para Todos, la Prensa y Villanueva. En asamblea convocada por sus directivas, los barrios aceptaron ser parte del proyecto SWACH.
Para la obtención de información respecto de los hábitos de consumo y percepción se construyó una encuesta con 65 preguntas, integradas en categorías referentes a: información de la vivienda y composición del grupo familiar; percepción del consumo de agua, actividades y prácticas del hogar que demandan agua; percepción de la disponibilidad de agua bajo escenarios de cambio climático; predisposición a aplicar cambios en los hábitos de consumo.
Las encuestas se levantaron entre mayo y junio de 2023, involucrando a 850 personas en total, en grupos familiares correspondientes a:
110 Casa Para todos
62 La Prensa
63 Villanueva
La determinación del número de encuestas por barrio se realizó considerando la cantidad de predios/medidores de agua potable; el levantamiento de las encuestas se realizó con el apoyo de estudiantes de Ingeniería Ambiental de la UDA, mientras que estudiantes de la U. de Cuenca colaboraron en la lectura manual de medidores semanalmente, durante un período de 5 meses.
A la fecha, octubre 2024, nos encontramos en la determinación de “hogares piloto” dentro de los tres barrios con los que, a través de visitas domiciliares, se profundiza la información sobre los usos, hábitos, frecuencia y características de la vivienda que influyen en el consumo de agua.
A la par del análisis de los datos levantados por SWACH, se analizan los datos de consumo proporcionados por ETAPA-EP.
Como resultados provisionales tenemos:
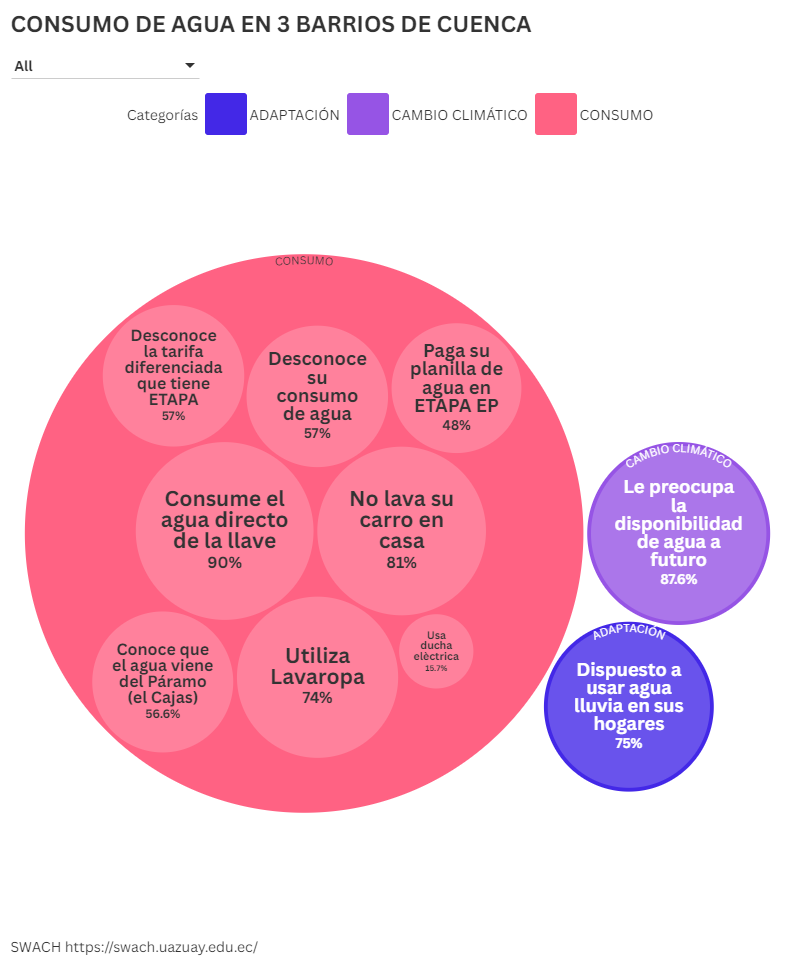
INFORMACIÓN DE ENCUESTAS:
| Desconoce cuantos m3 de agua consume al mes | 57% |
| No SABE que existe una tarifa diferenciada de agua potable | 57% |
| Lava a mano la vajilla | 96% |
| Hogares que cocinan en casa | 90,7% |
| Hogares que beben agua directo de la llave | 91% |
| Piensa que el agua para su vivienda viene del PN El Cajas + el Páramo | 56,6% |
| Manifiesta preocupación por la disponibilidad de agua a futuro | 87,6% |
| Hogares que utilizan calefón a gas | 82% |
| Hogares que utilizan ducha eléctrica | 15,7% |
| Manifiestan que NO lavan ningún auto en la casa | 81% |
| El tiempo medio de ducha en los 3 barrios es de 10 min. | |
| Están dispuestos a usar el agua lluvia | 75% |
| Utilizan lavadora de ropa | 74% |
PROMEDIO HISTÓRICO DE CONSUMO DE AGUA EN LOS TRES BARRIOS:
Analizados los datos de consumo proporcionados por ETAPA-EP desde 2008 a mayo 2024 se observa una ligera disminución en el promedio de consumo (de 23m3 a 21m3)
CONSUMO MENSUAL 2008-2023 BARRIOS CASA PARA TODOS, LA PRENSA, VILLANUEVA
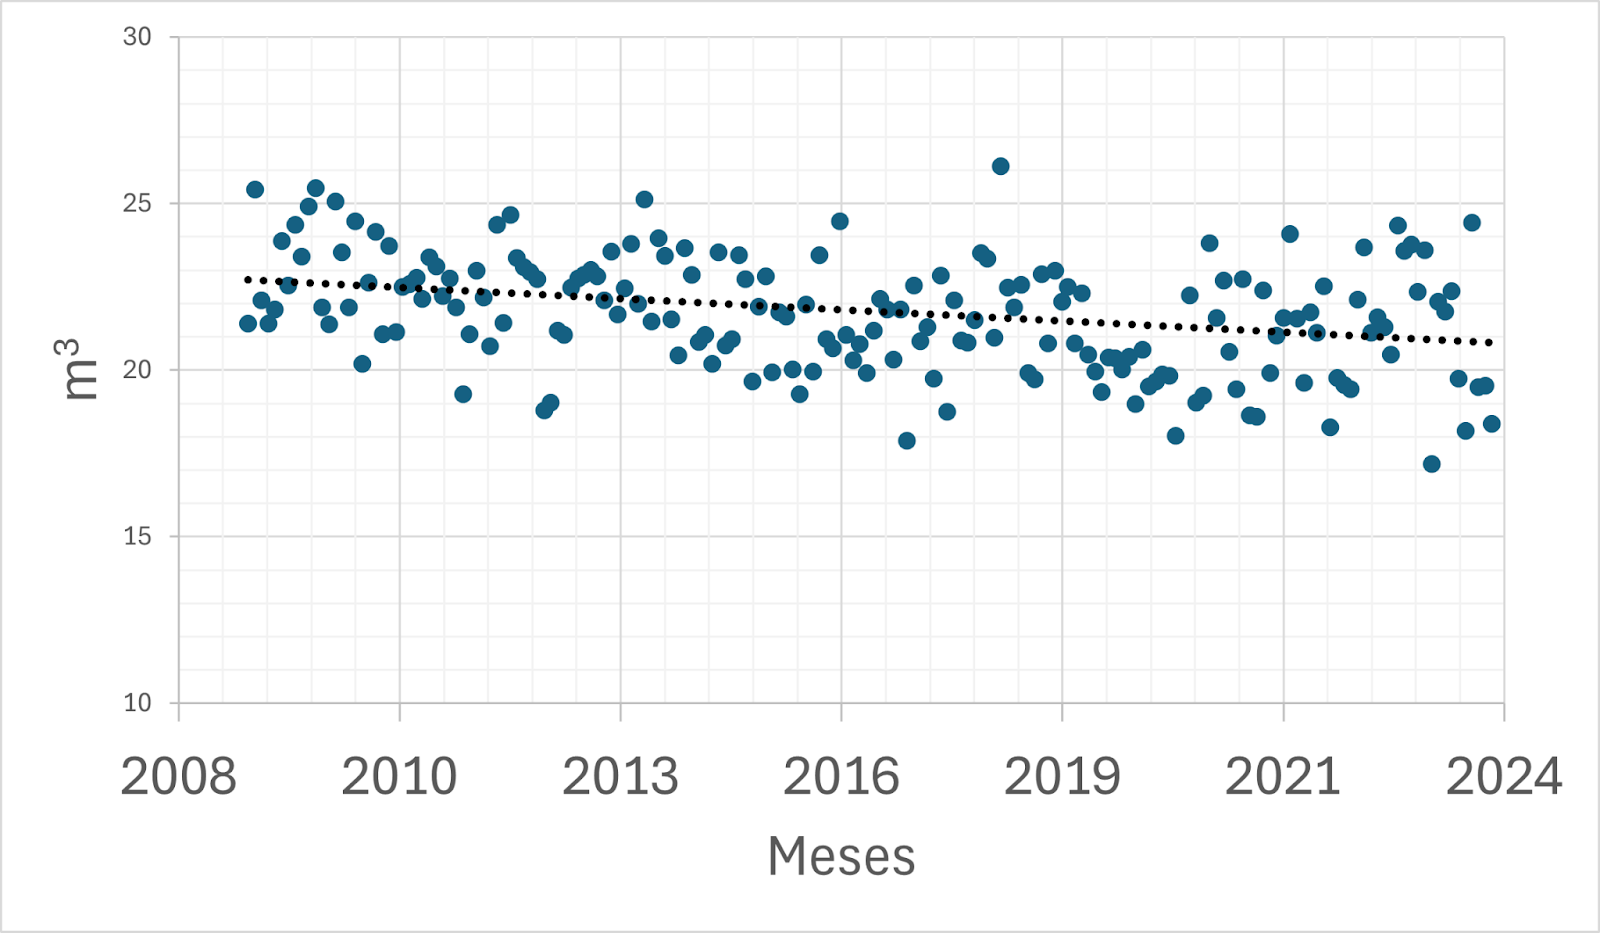
Fuente: ETAPA-EP. Elaboración: SWACH
DOTACIÓN DE AGUA DIARIA (EN LITROS) PARA LOS TRES BARRIOS:
Analizada la información de consumo reportada por ETAPA-EP frente al número de habitantes por hogar, según la información levantada por SWACH, nos encontramos con que existe una tendencia que marca una relación directamente proporcional que indica que a mayor número de personas por hogar, menor consumo pércapita.
En esta gráfica se puede observar también una diferencia significativa entre los barrios, siendo los hogares de 4 personas los que presentan un comportamiento más homogéneo.
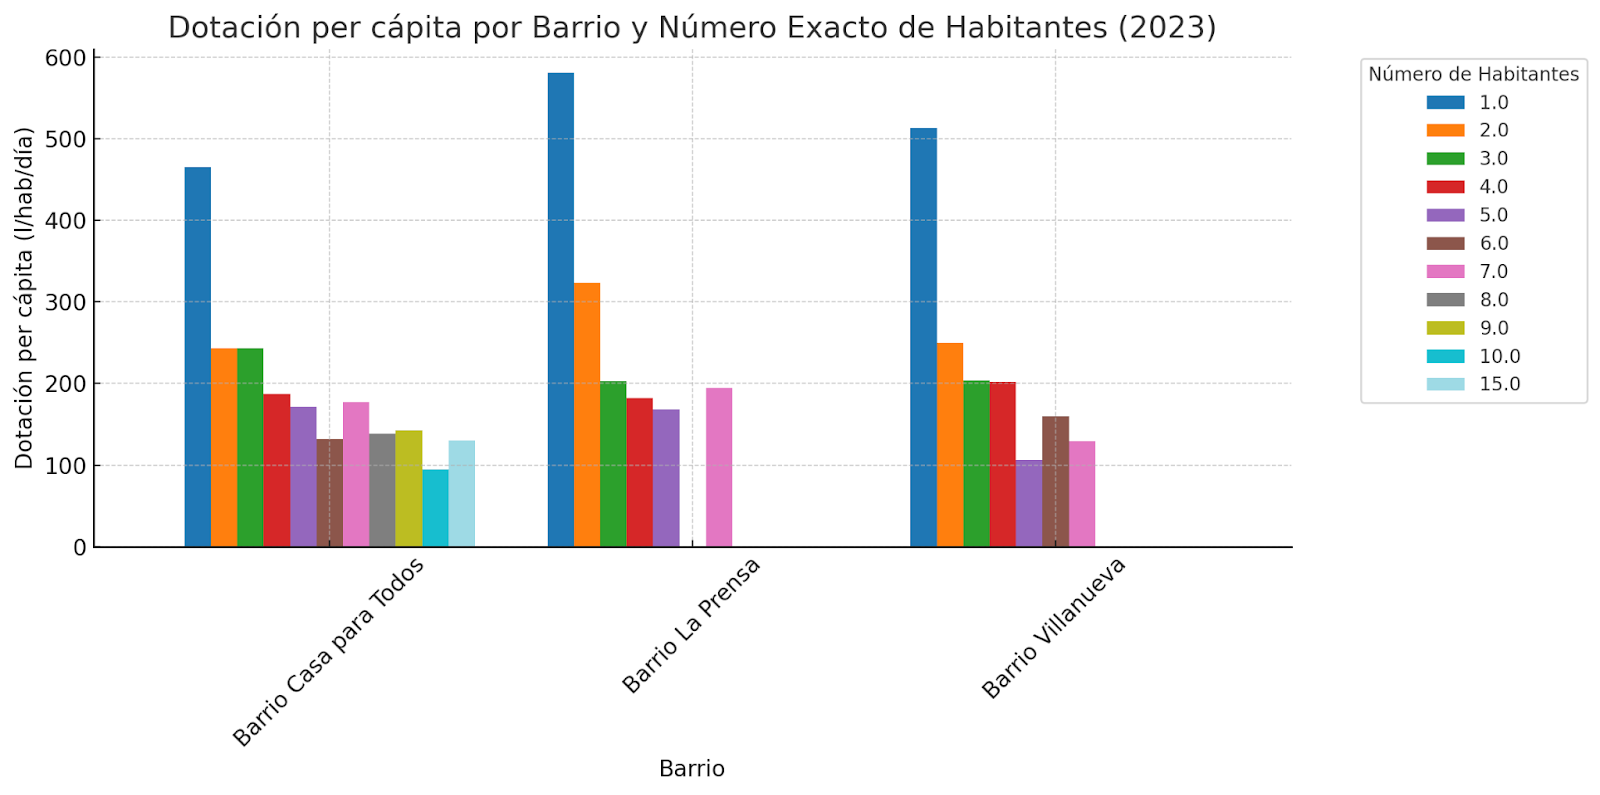
Fuente: ETAPA-EP y SWACH
Elaboración: SWACH
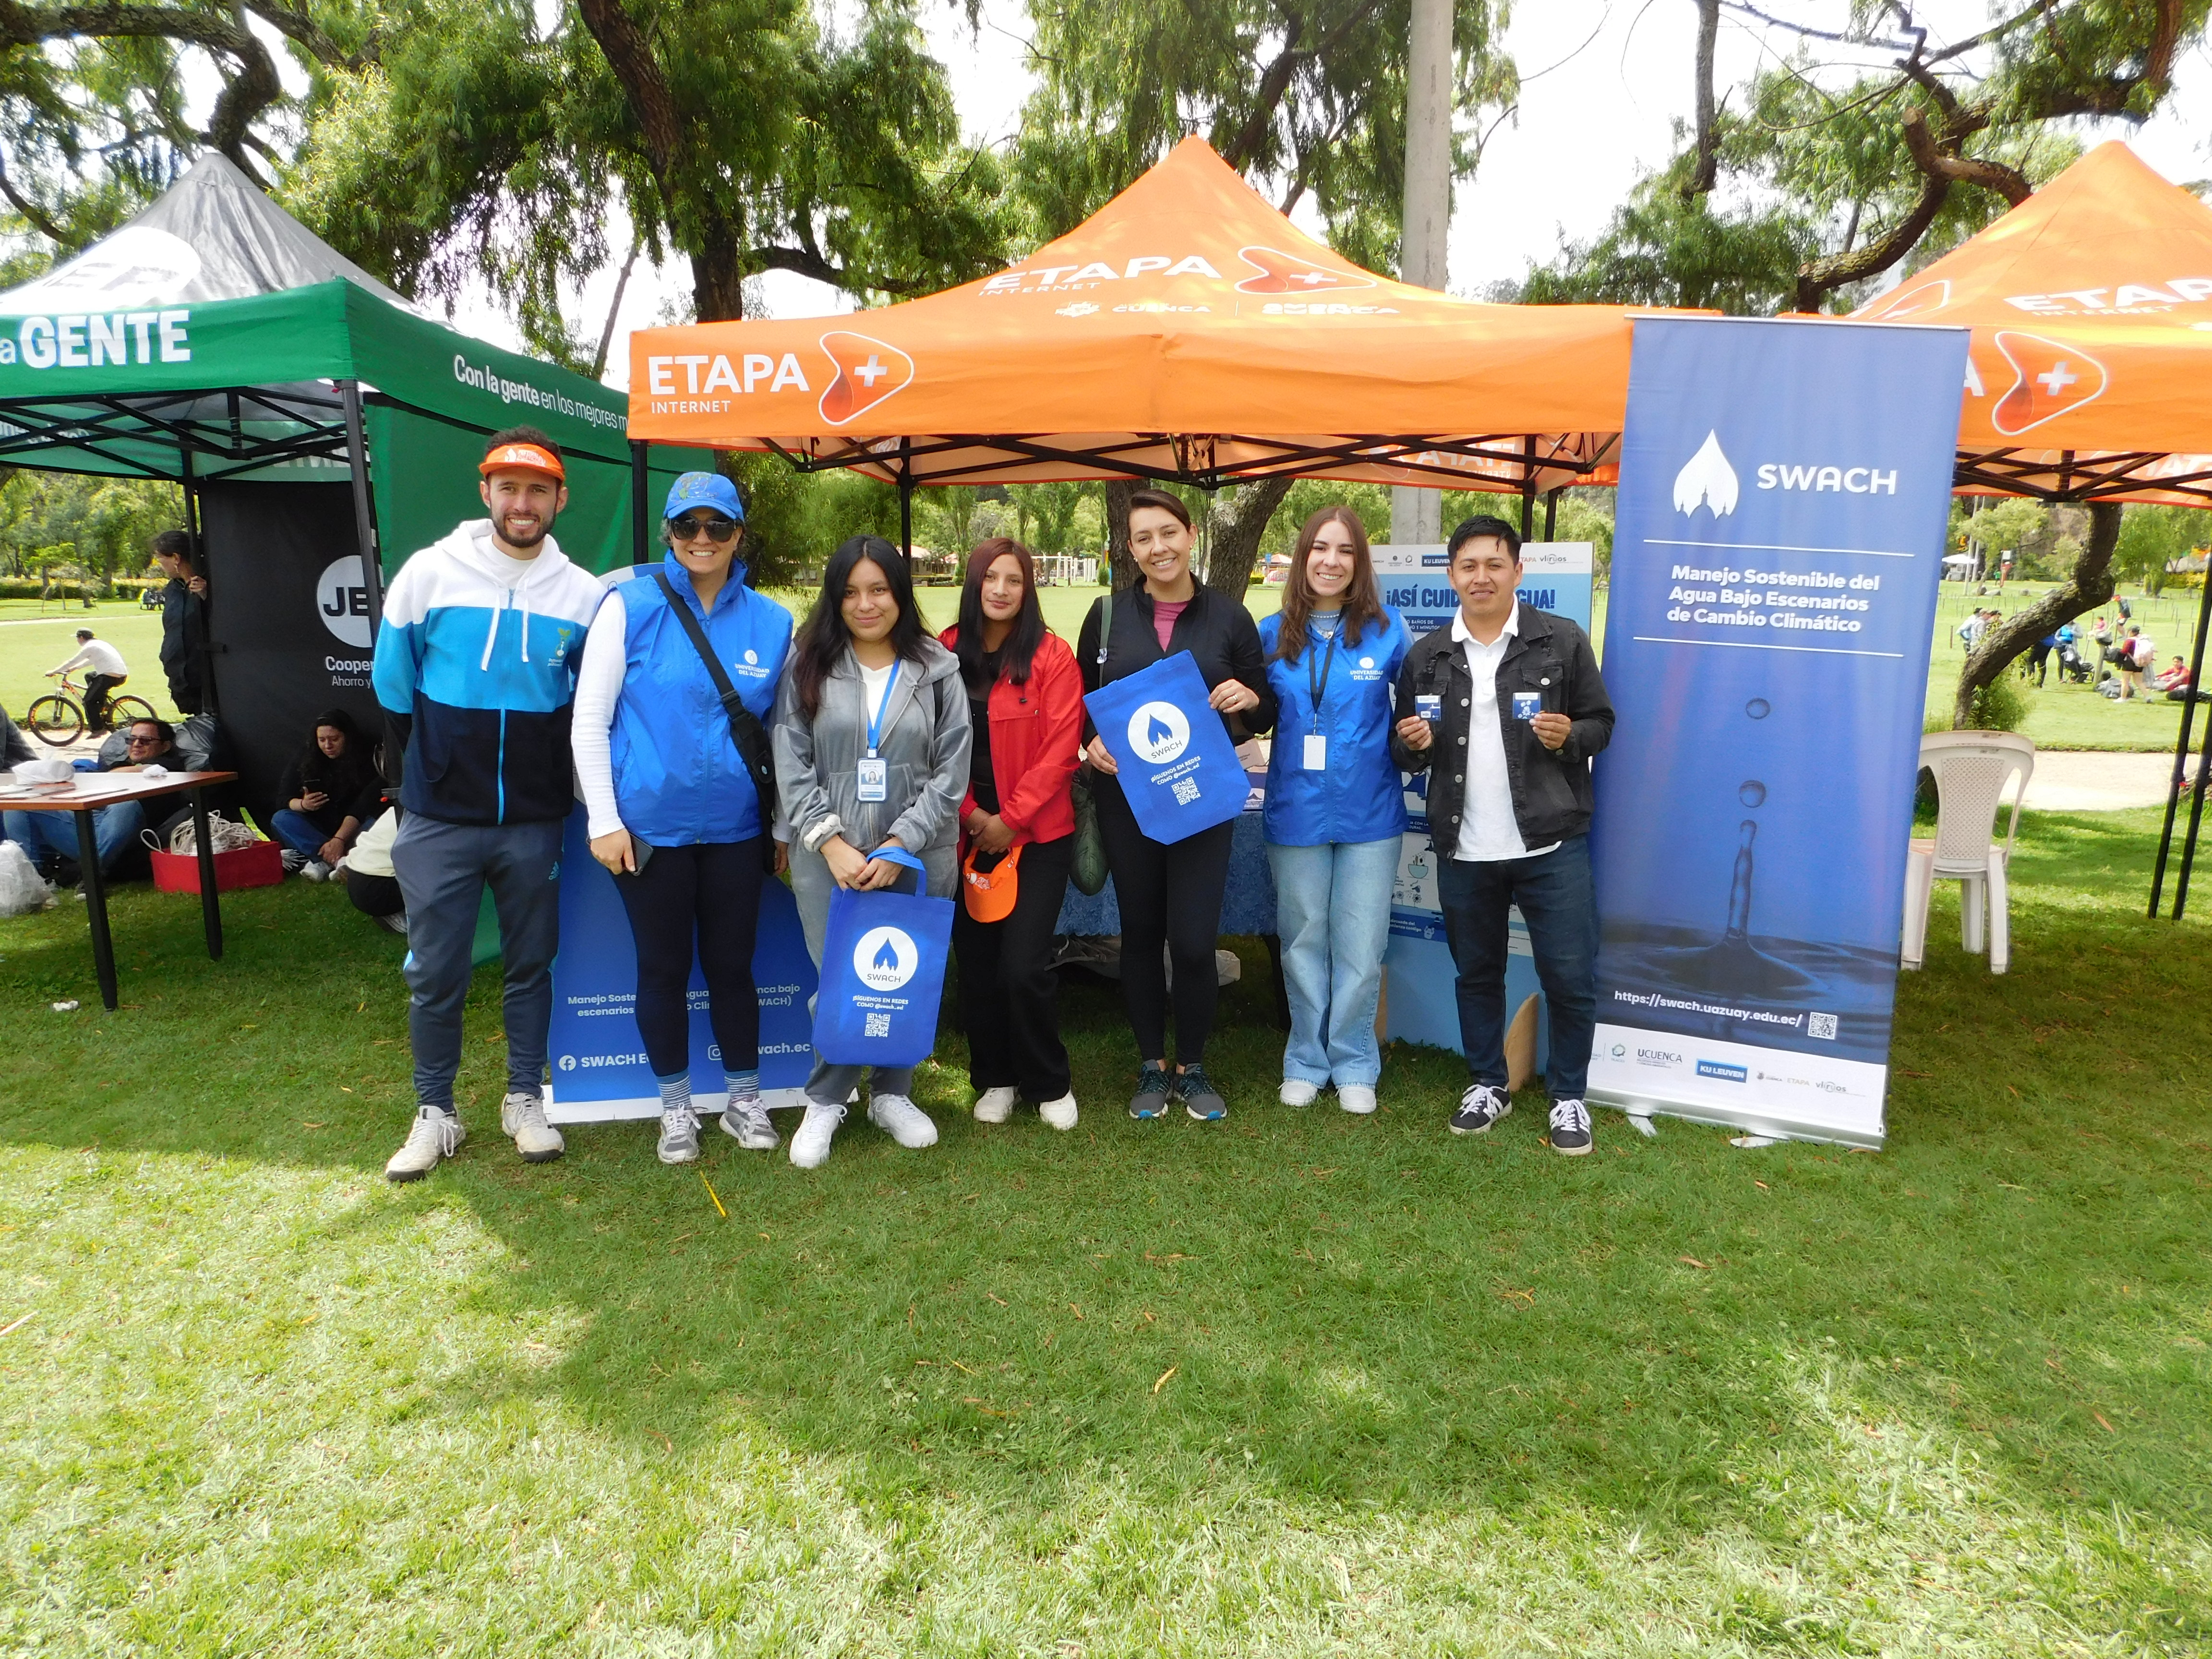
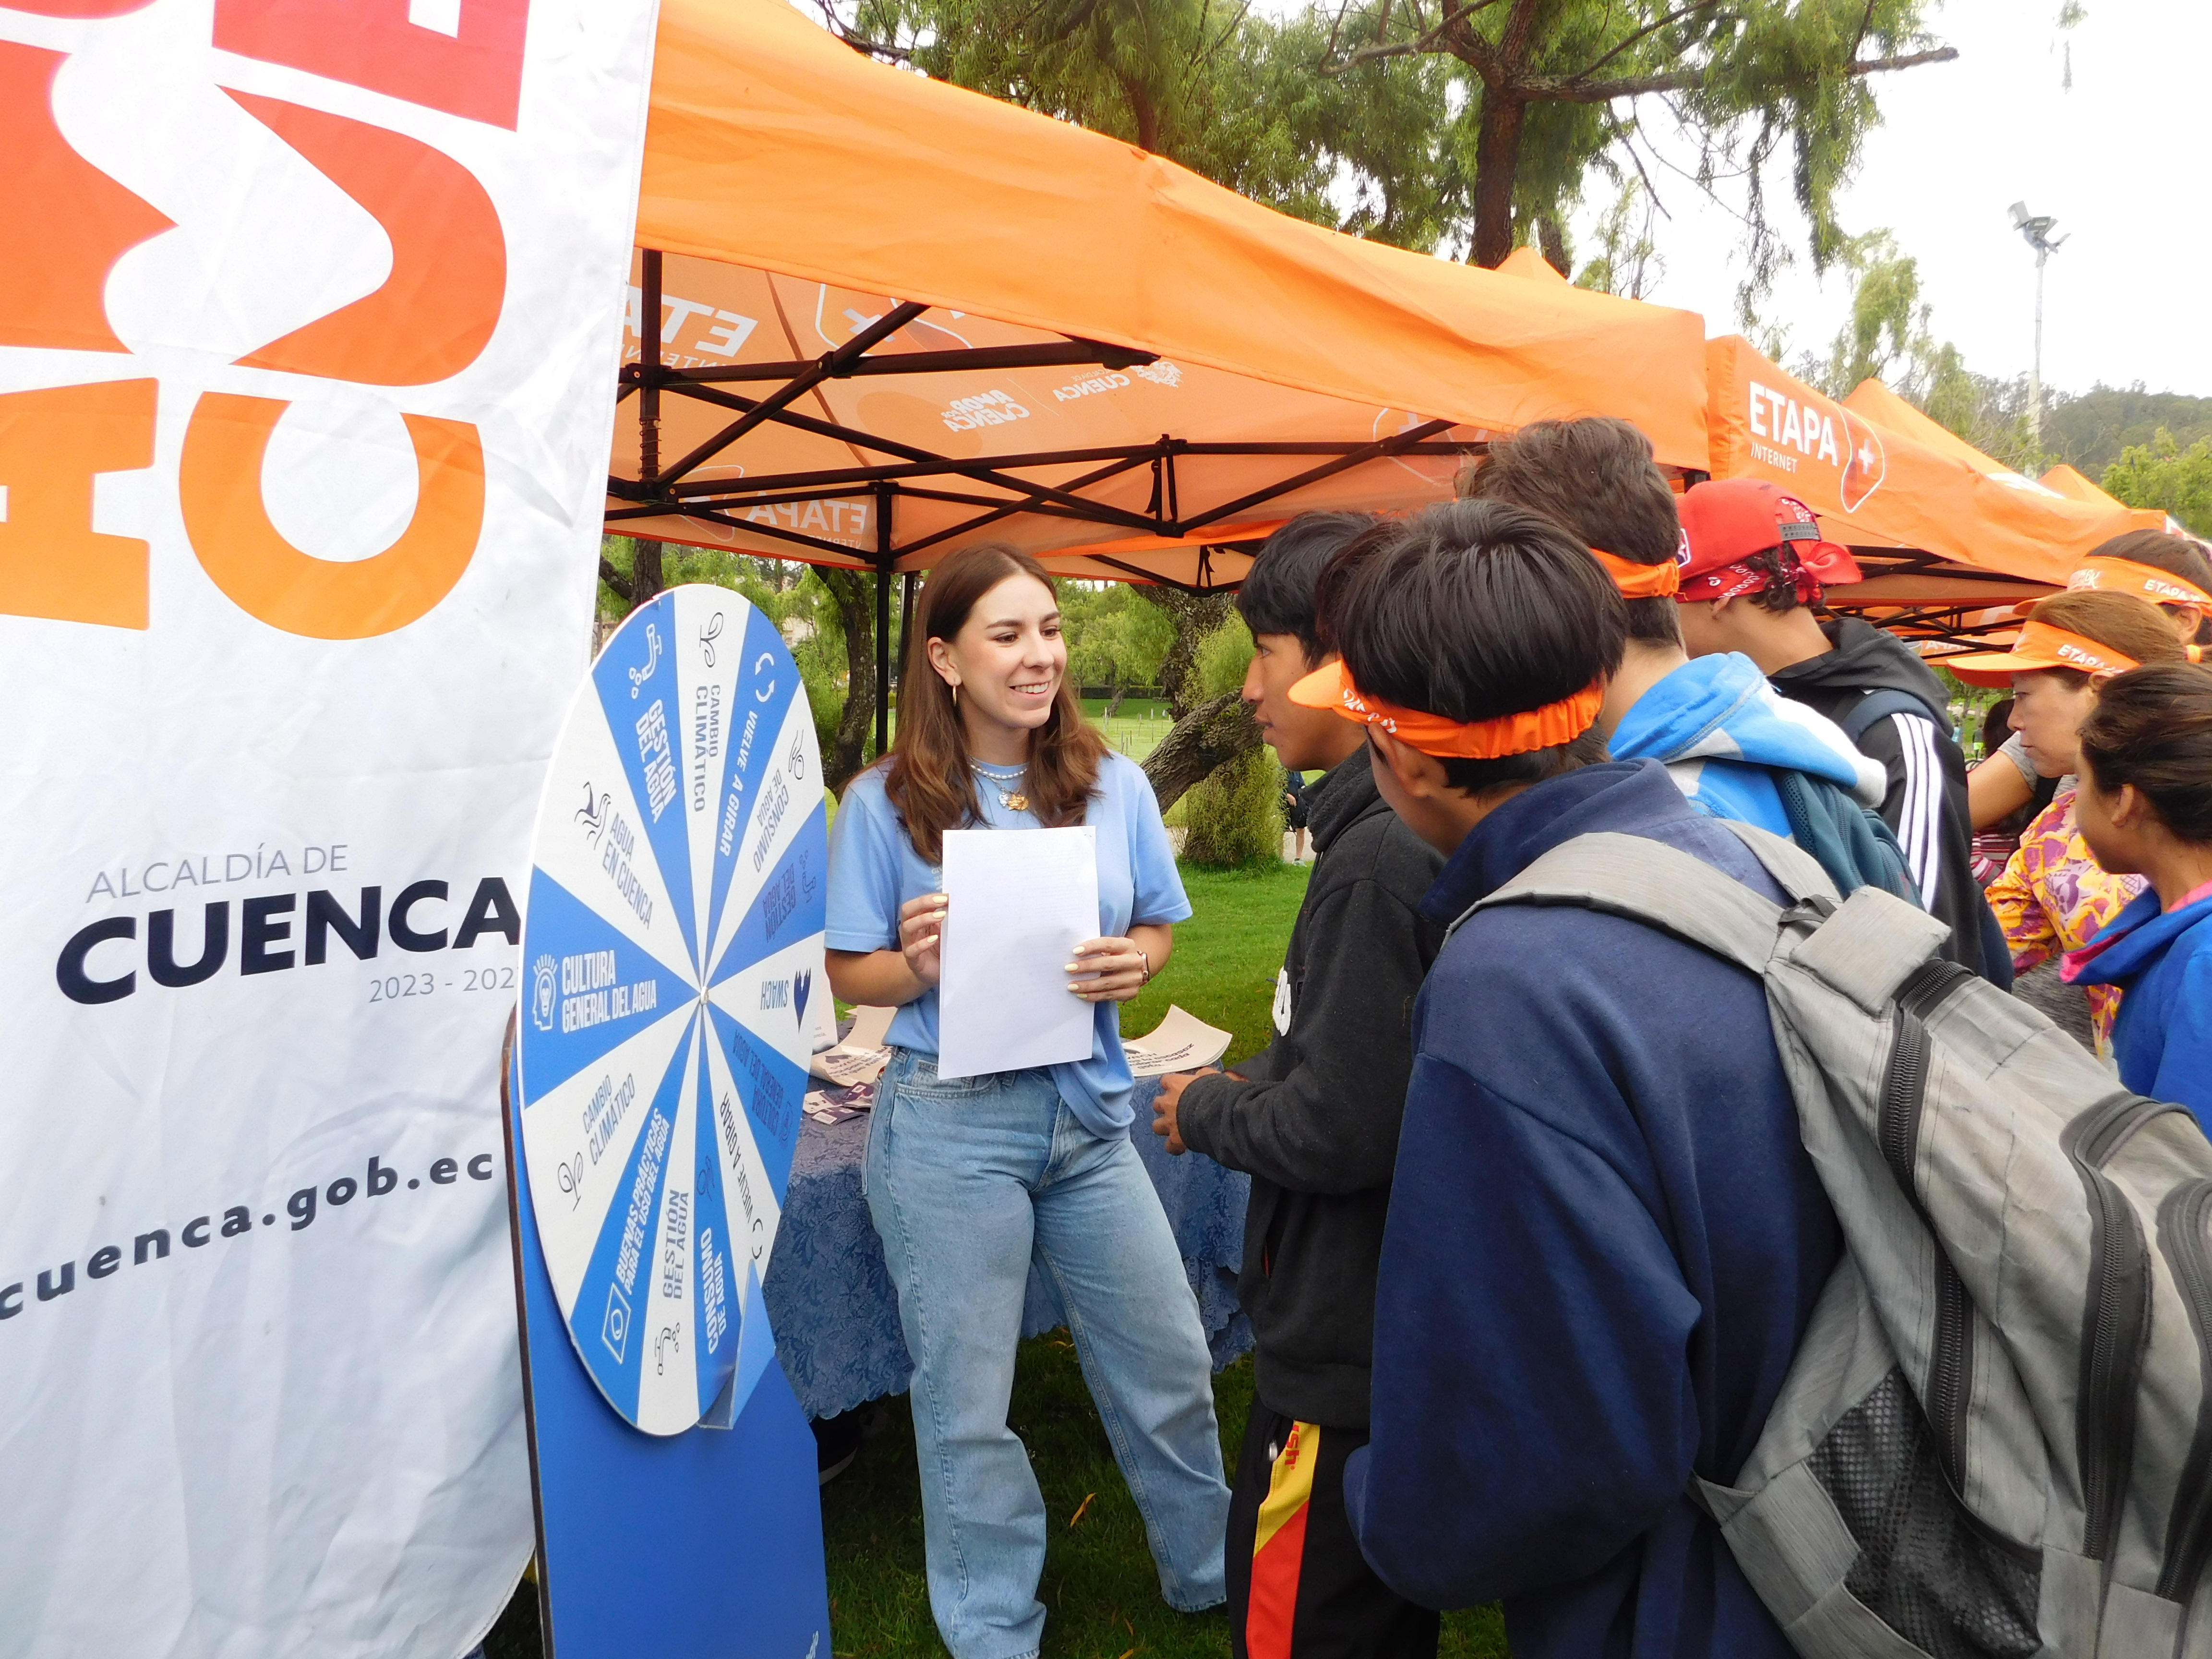
Si quieres conocer más información sobre SWACH y el estudio de demanda de agua potable en los tres barrios seleccionados y las posibles estrategias para consumo responsable, escríbenos a: swach@uazuay.edu.ec.
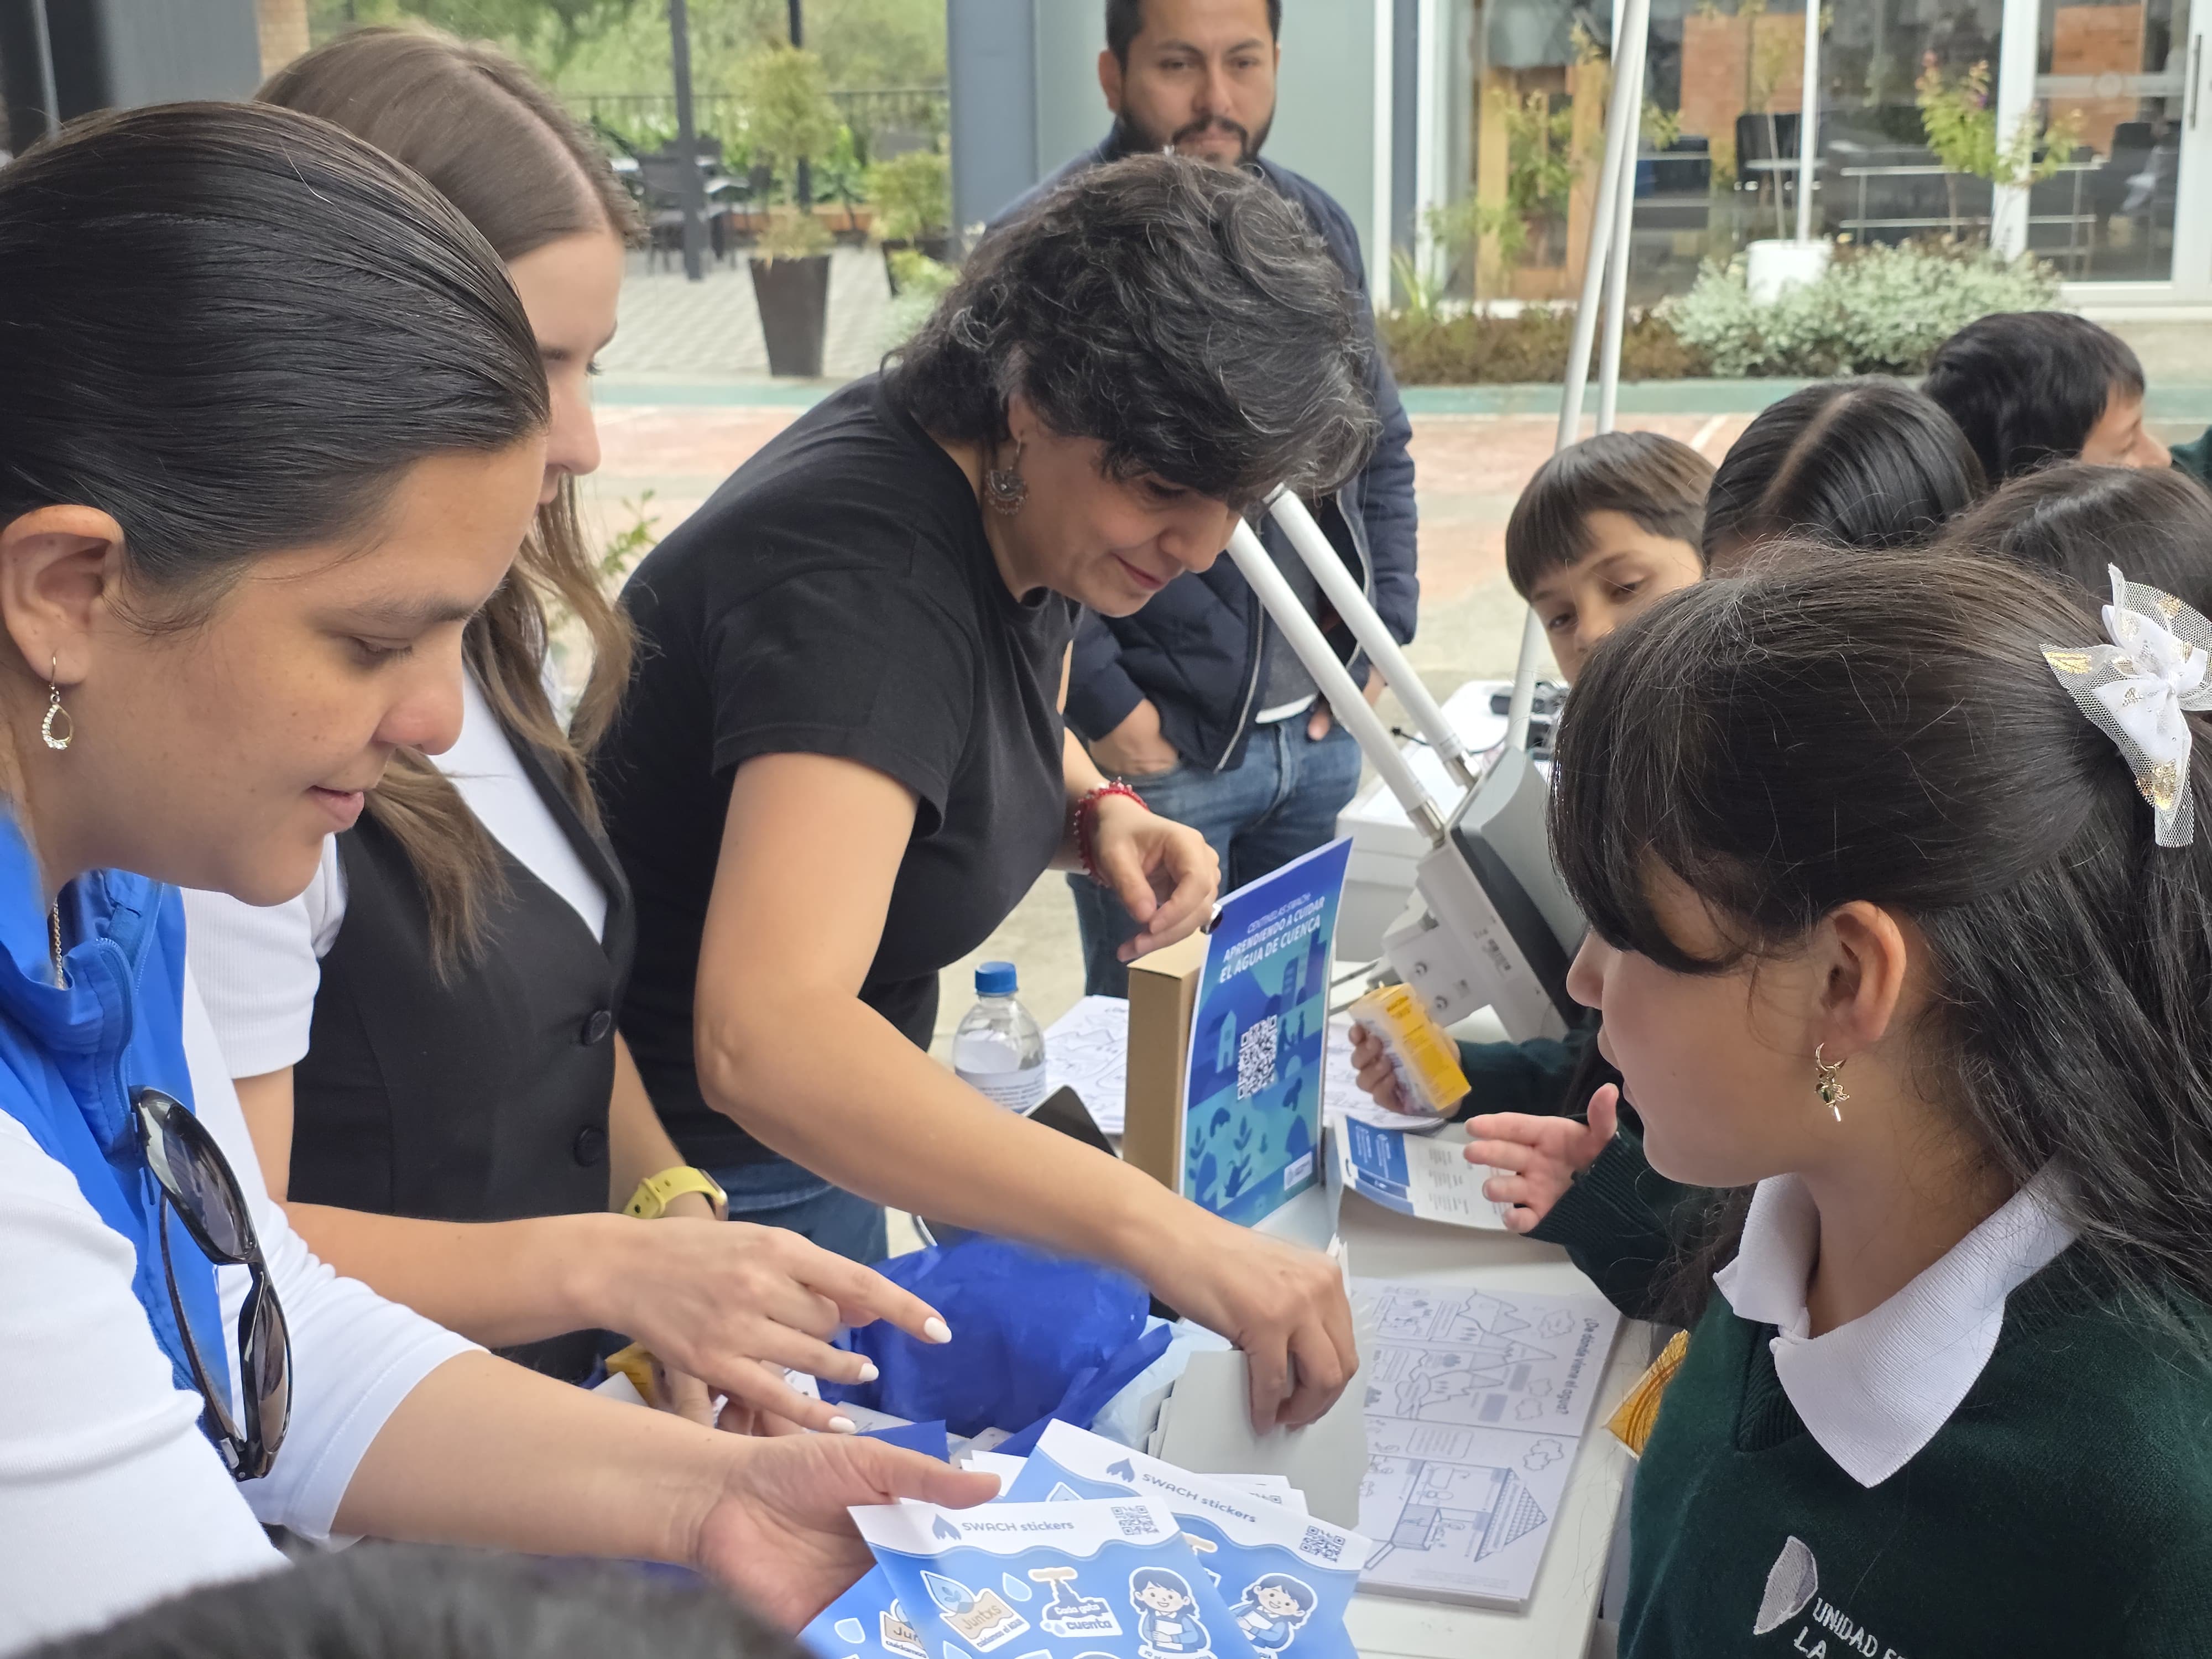
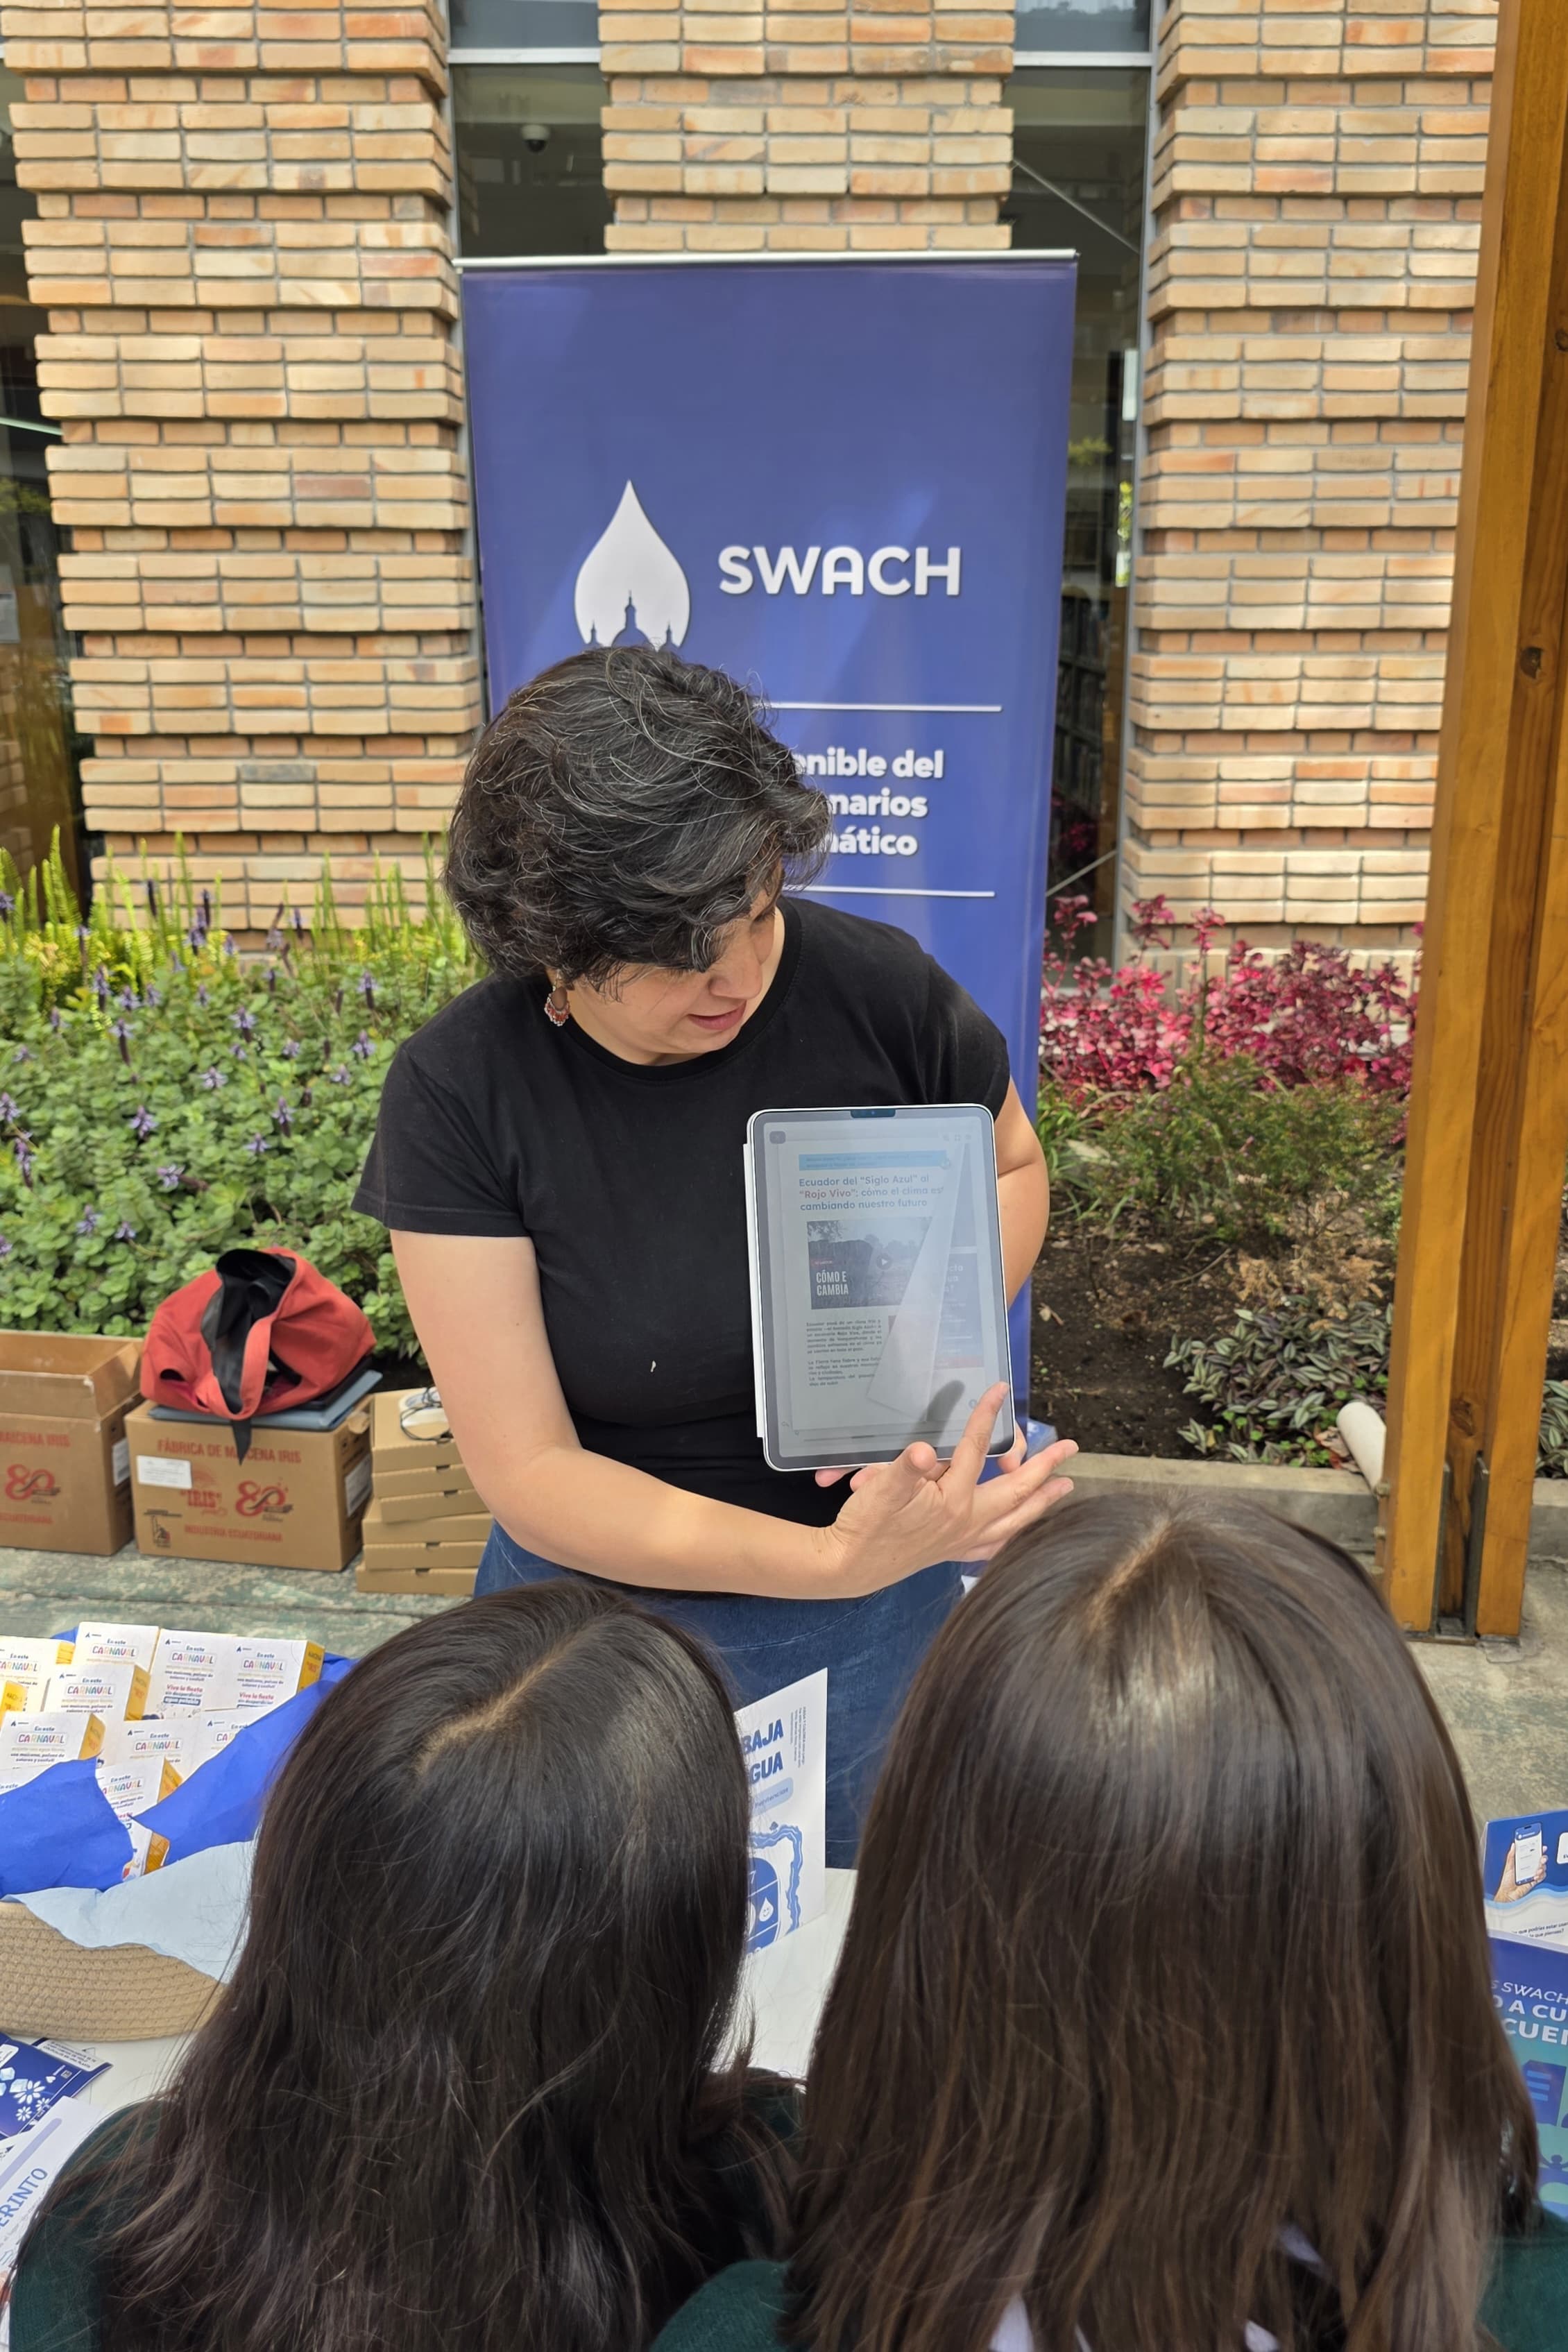
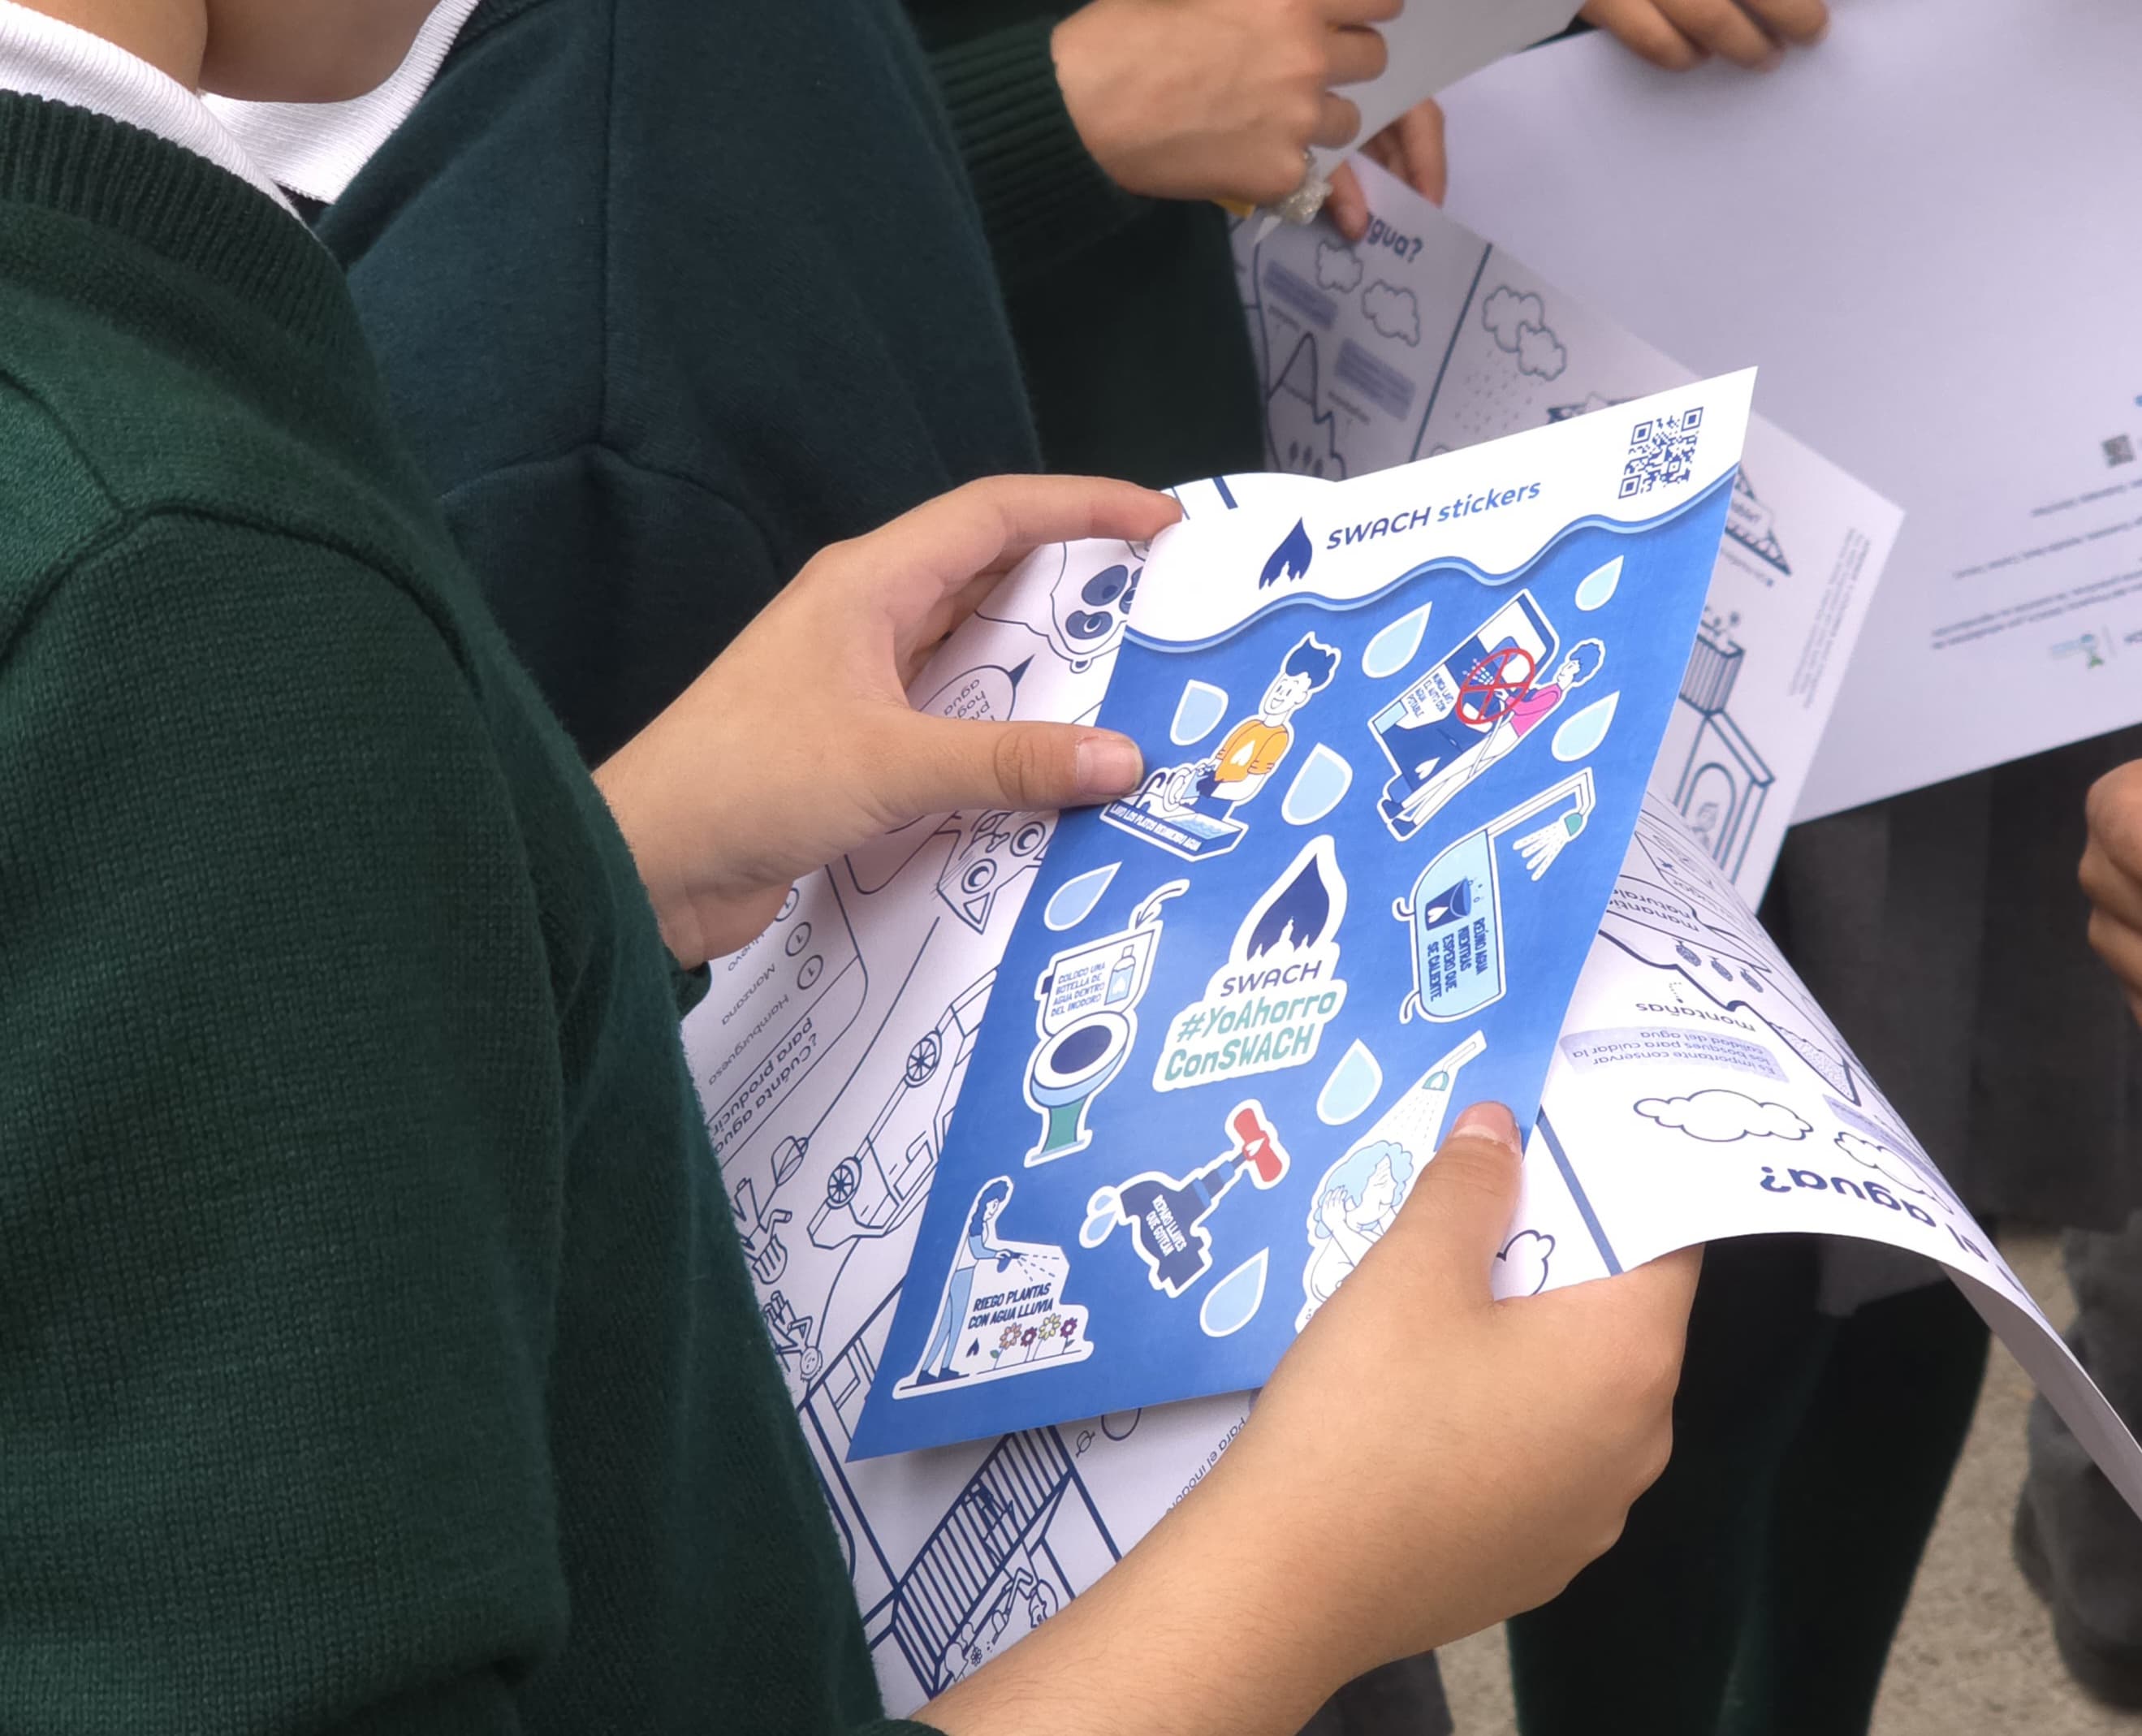
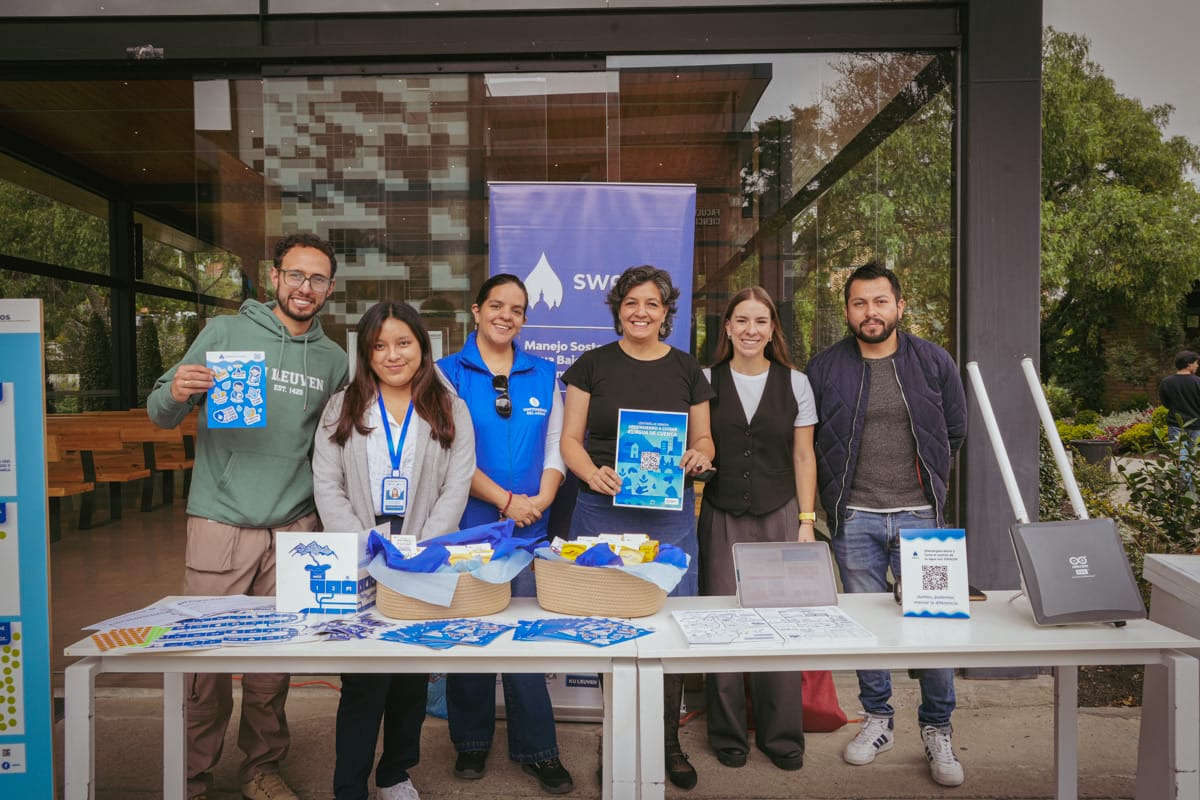
Elaboración: Equipo social SWACH


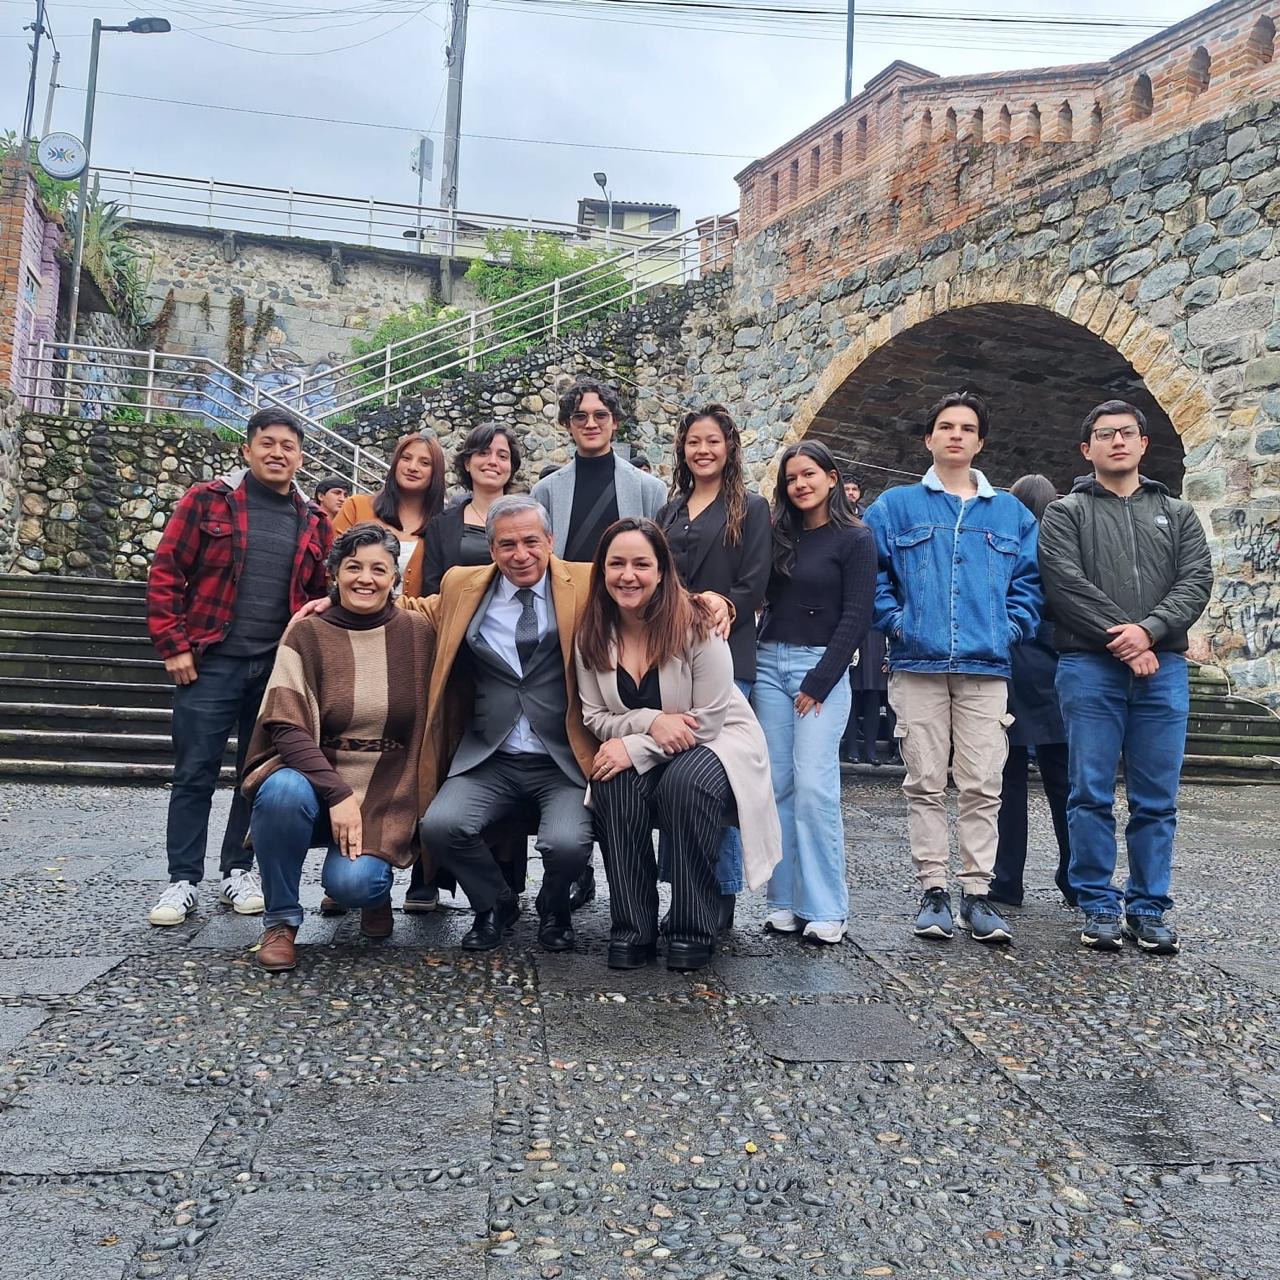
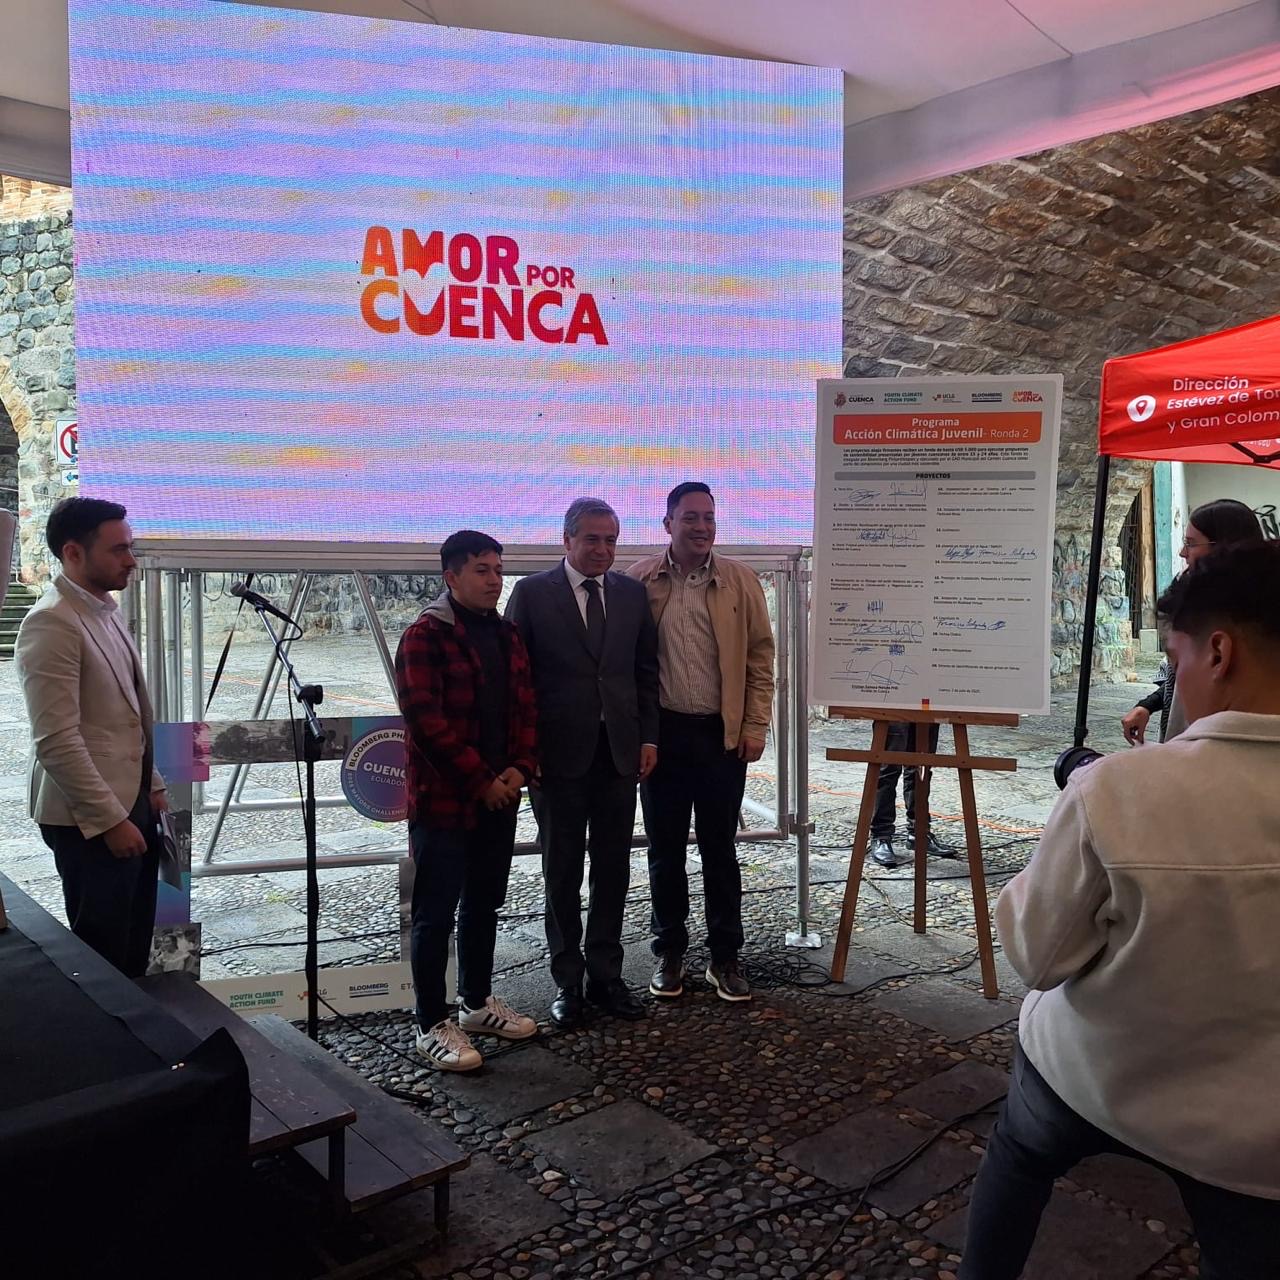


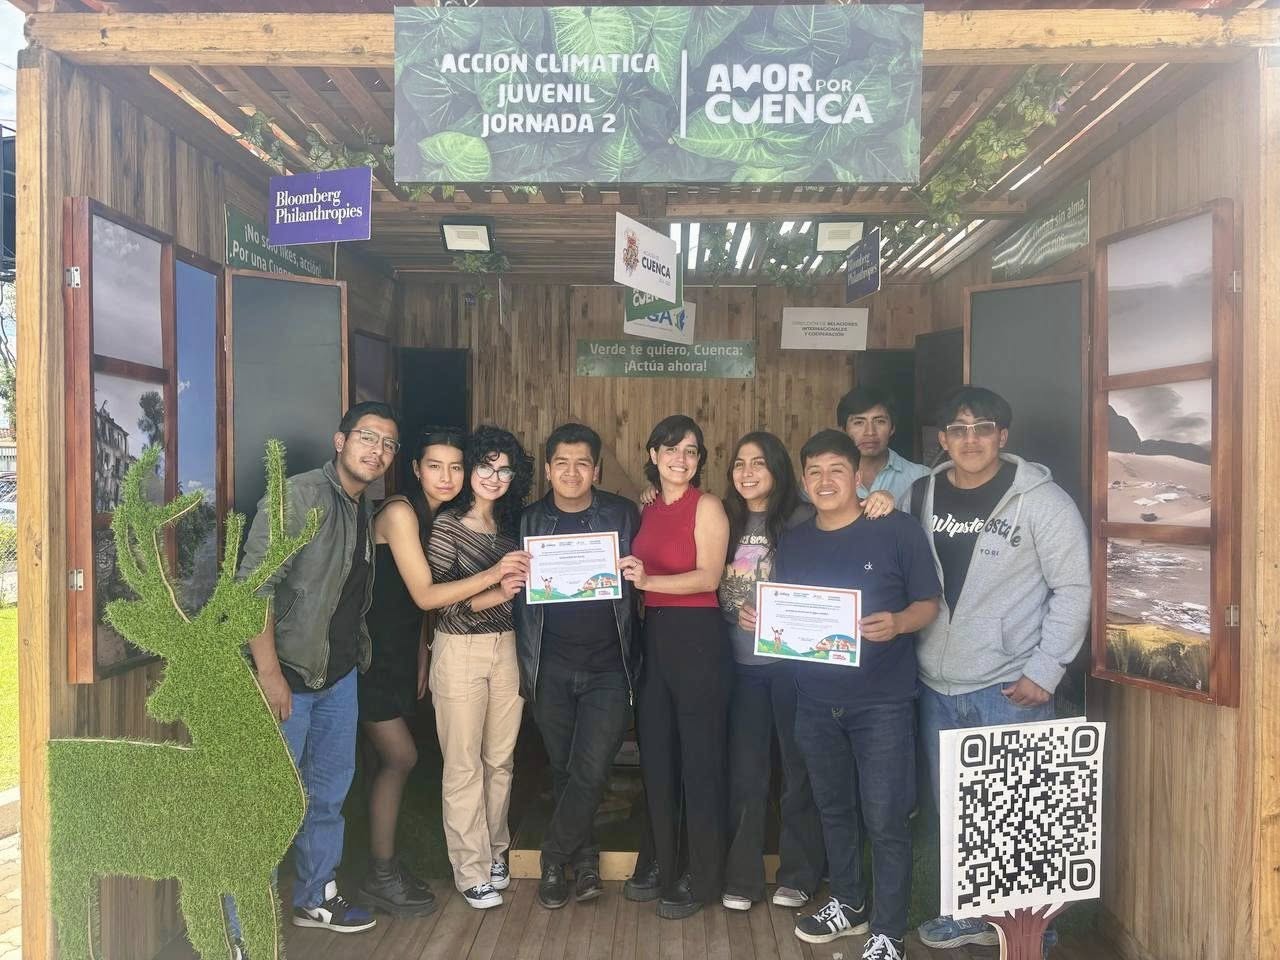
 Felicitamos profundamente a Leydi y Santiago por su dedicación, compromiso y visión transformadora. Su esfuerzo es una inspiración para seguir avanzando con ciencia, participación y amor por nuestro recurso más valioso.