

Historical Rainfall Observations in the Paute River Basin: Correction of the RAIN4PE Product Using All Available In-situ Stations (ETAPA, INAMHI, iDRHiCA, UDA, and CELEC).
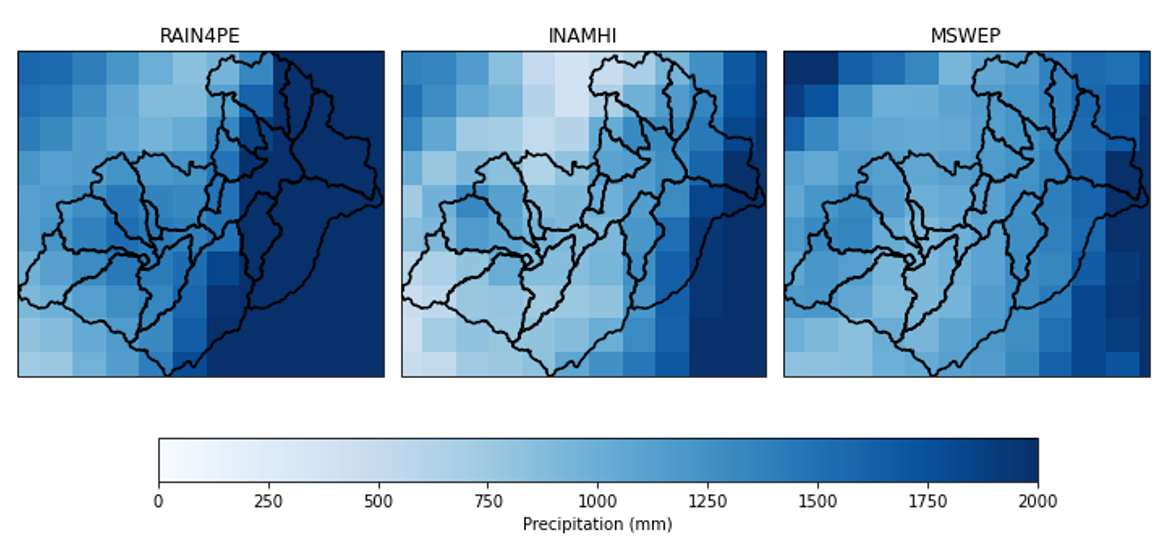
Currently, there are two main sources of historical meteorological observations for characterizing past climate conditions. On one hand, there are point-based records from in-situ stations managed by institutions such as INAMHI, ETAPA, CELEC, the University of Cuenca, and the University of Azuay. On the other hand, gridded remote sensing products have become increasingly available due to advances in computational capabilities. Both sources present advantages and limitations. While station data provide in-situ measurements, they represent only a single point in space. In contrast, gridded data offer good spatial representation of patterns but often contain systematic errors in magnitude. These discrepancies between data sources can increase uncertainty in the historical record. To illustrate this, Figure 1 presents the average annual rainfall in the Paute region as derived from two remote sensing products and one based on in-situ station data. As shown, some areas exhibit strong agreement among the products, while others—such as the Yanuncay sub-basin—display significant differences.
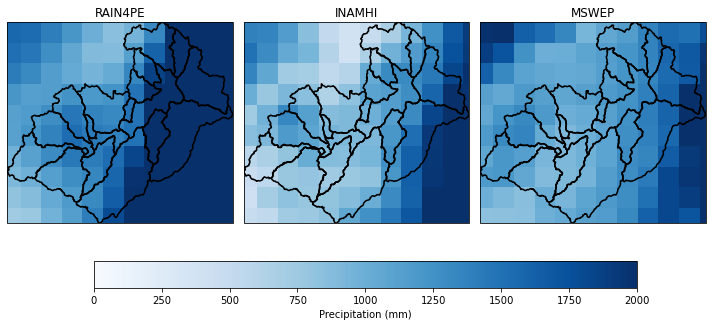
Figure 1. Average Annual Rainfall in the Paute River Basin (1981–2015) According to Three Different Observation Products
Due to these discrepancies, it was considered necessary to perform a correction and data fusion process between observed and remotely sensed data in order to eliminate systematic errors and produce a consolidated product with reduced uncertainty. By compiling information from various sources, a large database of meteorological stations and remote sensing products was assembled. It is important to note that only the INAMHI dataset includes historical station records dating back to 1981. Based on tests and comparisons among different methods, a data fusion process was carried out using bias correction and Cressman interpolation techniques between the RAIN4PE observation product (Fernández-Palomino et al., 2021) and INAMHI meteorological stations. Additionally, data from ETAPA, universities, and CELEC were used to validate the product. Figure 2 presents an example of the product’s validation using an in-situ station located at Toreadora. The results show low bias and good representation of precipitation, even in the high-altitude region of El Cajas.
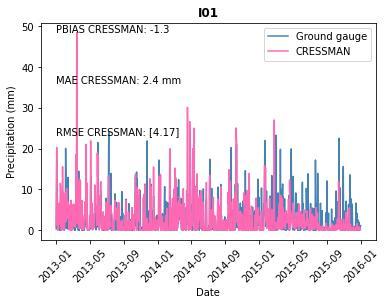
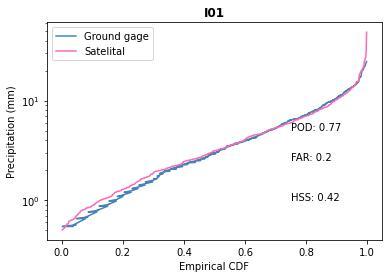
Figure 2. Daily Precipitation from the Station and the Interpolated Product Shown in Chronological Order (left) and Sorted from Highest to Lowest (right)
Another important aspect for validating the gridded product is its ability to represent historical droughts. This is particularly relevant given the recent drought events in the Austro region of Ecuador during 2023 and 2024. Figure 3 presents a comparison of the representation of the 2009–2010 meteorological drought among the meteorological station, the RAIN4PE product, and the corrected gridded dataset. It can be observed that the period of rainfall deficit, based on the Standardized Precipitation Index (SPI), is more accurately captured when station data are integrated through the fusion process.
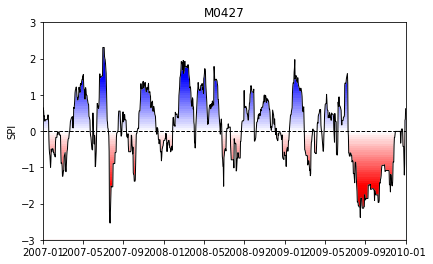
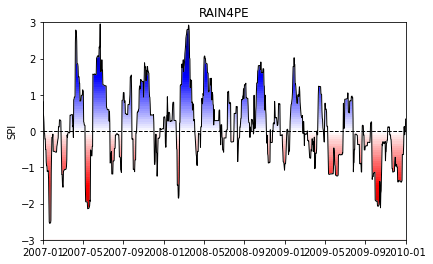
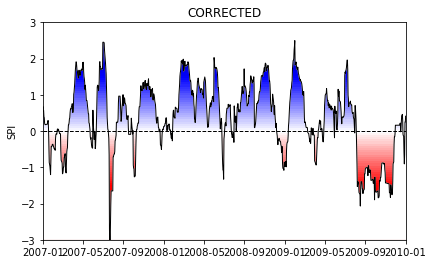
Figure 3. Historical Evolution of the Standardized Precipitation Index (SPI) Across Three Different Products: Meteorological Station (left), RAIN4PE (center), and the Gridded Dataset from the Data Fusion (right).
For research or validation purposes, you may request access to this product by contacting: swach@uazuay.edu.ec
Elaborated by: Santiago Xavier Núñez Mejía
