

Climate Change Indicators for the 2021–2050 Period Based on Existing Projections for Ecuador (MAATE, NASA, Fernández-Palomino, 2024).
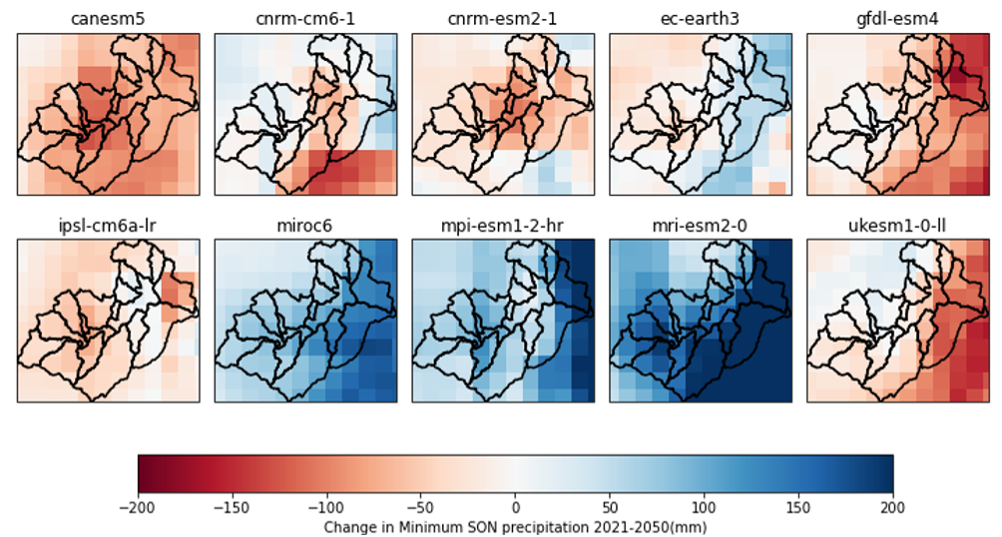
In addition to historical data, available future climate projections have been processed during recent months, including those published by Fernández-Palomino (2024) and the national projections from MAATE (2016 and 2021). Given the current context of droughts, quarterly precipitation for September–October–November (SON) was selected as a climate hazard indicator. It is worth noting that these indicators can be adapted depending on the specific hazard of interest. In this case, Figure 1 presents the projected change signal, i.e., the difference between future and historical values. Negative values (in red) indicate a projected decrease in rainfall during the SON trimester, while positive values (in blue) suggest an increase. Interestingly, the projected variations in the future differ depending on the climate model used. Based on their historical pattern representation (not shown), the models MIROC6, MPI-ESM1-2-HR, and MRI-ESM2-0 exhibit lower reliability and therefore show a divergent signal from the rest. For the time being, it can be concluded that some projections suggest a reduction in rainfall during this trimester in the Paute River Basin. This analysis will be extended with additional projections—both existing and forthcoming—over the course of this year.
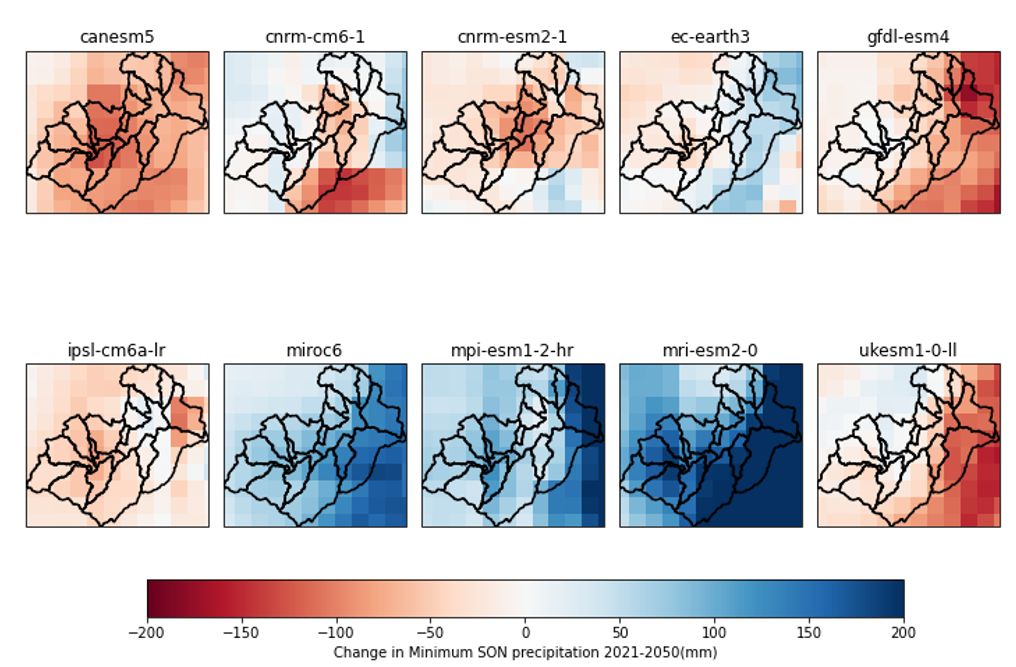
Figure 1. Change in SON (September–October–November) Quarterly Precipitation Between 2021–2050 and 1981–2015 in the Paute River Basin Based on 10 Global Climate Models After Statistical Downscaling.
Another commonly used method for drought analysis at a national level is the CDD index (Consecutive Dry Days). In this case, a graph is presented to illustrate how several statistically downscaled climate models (Trasher, 2022) project scenarios in which the maximum number of consecutive dry days increases during the 2021–2050 period. It is worth noting that, when considering the average across models, this number is nearly equal to the historical maximum. However, preliminary analyses suggest that the CDD index may not be the most appropriate metric for assessing droughts in high-altitude páramo regions. This is because the count can be interrupted by minor precipitation events—such as drizzle or light rain—that exceed the 1 mm or 2 mm threshold but do not meaningfully improve precipitation conditions.
If you are interested in accessing these results, providing feedback, or contributing additional indicators, please contact us at swach@uazuay.edu.ec
Elaborated by: Santiago Xavier Núñez Mejía
References:
Ministerio del Ambiente de Ecuador. (2016). Generación de proyecciones climáticas para la Tercera Comunicación Nacional de Cambio Climático de Ecuador, bajo los escenarios de emisión RCP del reporte AR5 del IPCC, Quito–Ecuador.
Ministerio del Ambiente, Agua y Transición Ecológica (MAATE) y Programa de Naciones Unidas para el Desarrollo (PNUD). (2021). Proyecciones Climáticas del Ecuador bajo los escenarios del AR6 y modelos de circulación global del Coupled Model Intercomparison Project 6 (CMIP6). Desarrollados en el marco de las actividades del "Plan Nacional de Adaptación". Quito, Ecuador: MAATE y PNUD.
Fernandez-Palomino, C.A., Hattermann, F.F., Krysanova, V. et al. High-resolution climate projection dataset based on CMIP6 for Peru and Ecuador: BASD-CMIP6-PE. Sci Data 11, 34 (2024). https://doi.org/10.1038/s41597-023-02863-z
Thrasher, B., Wang, W., Michaelis, A. et al. NASA Global Daily Downscaled Projections, CMIP6. Sci Data 9, 262 (2022). https://doi.org/10.1038/s41597-022-01393-4
